
ENGR.ECONOMIC ANALYSIS
14th Edition
ISBN: 9780190931919
Author: NEWNAN
Publisher: Oxford University Press
expand_more
expand_more
format_list_bulleted
Related questions
Question
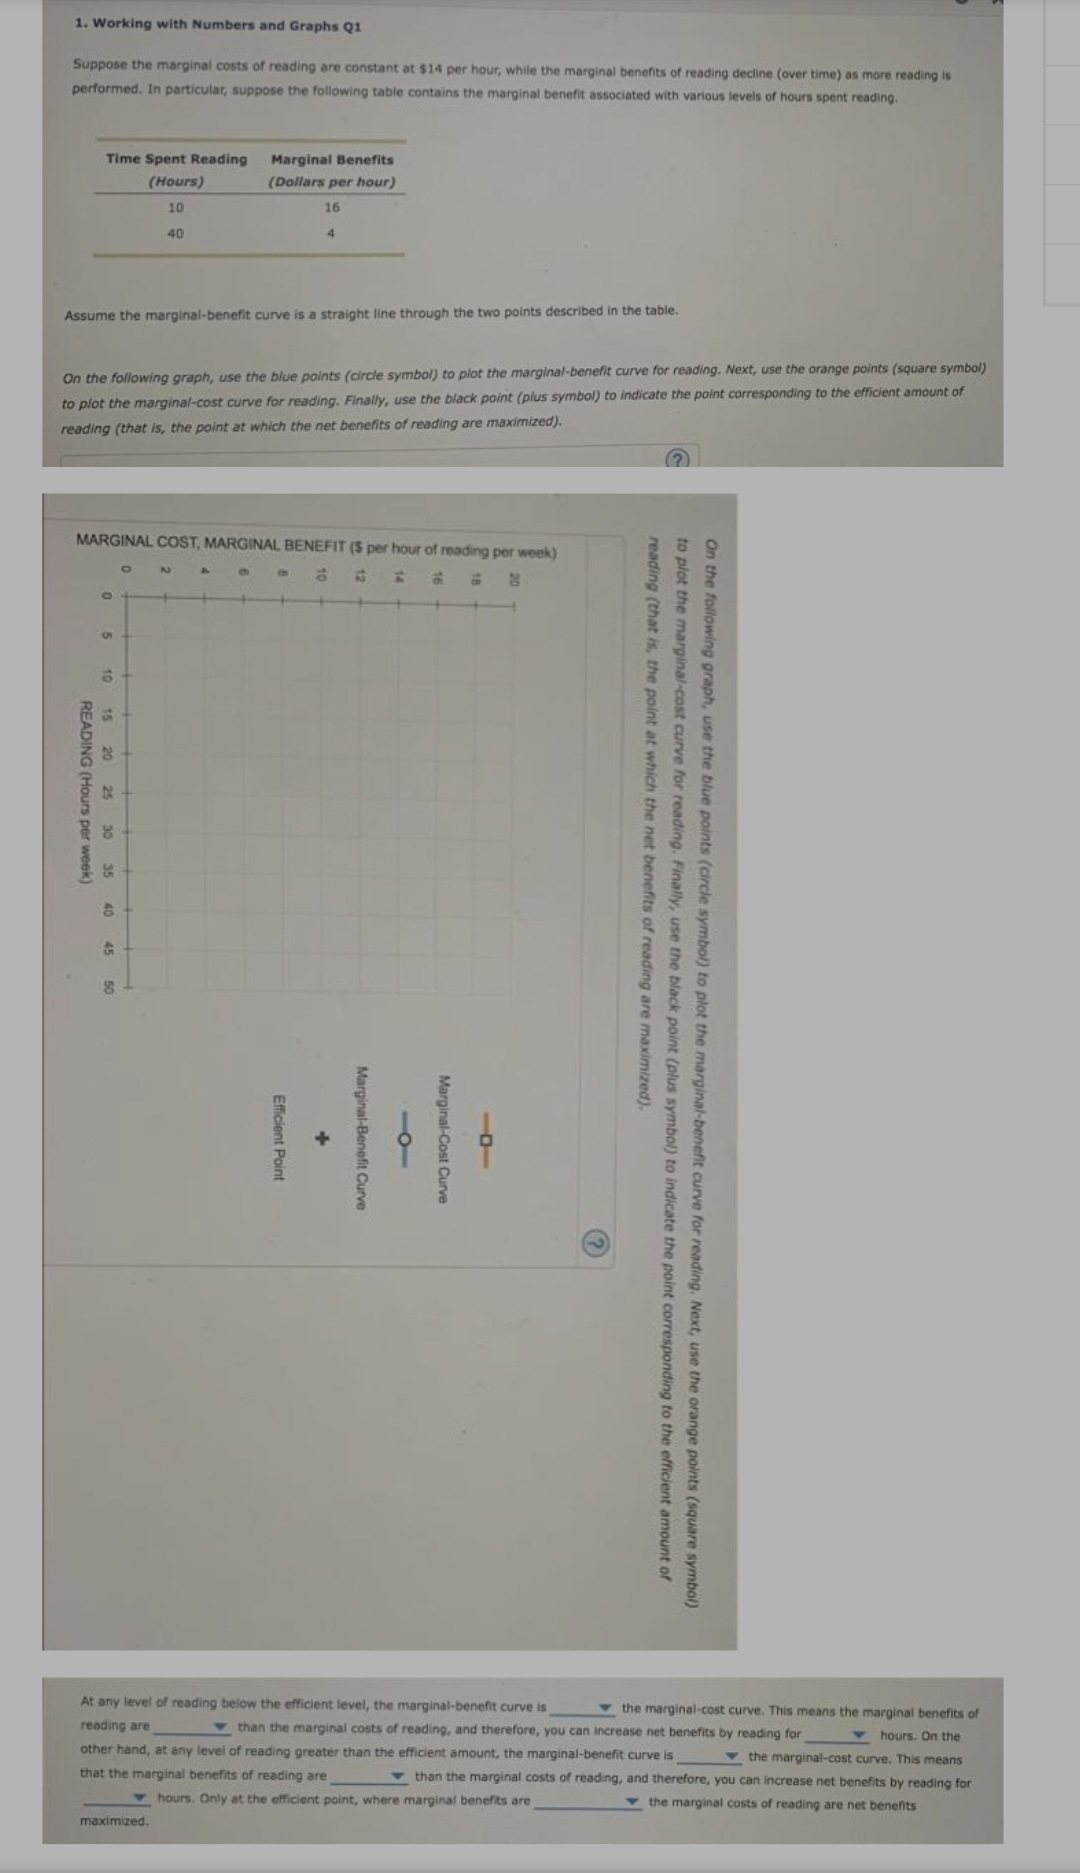

Transcribed Image Text:1. Working with Numbers and Graphs Q1
Suppose the marginal costs of reading are constant at $14 per hour, while the marginal benefits of reading decline (over time) as more reading is
performed. In particular, suppose the following table contains the marginal benefit associated with various levels of hours spent reading.
Time Spent Reading
Marginal Benefits
(Hours)
(Dollars per hour)
10
16
40
4.
Assume the marginal-benefit curve is a straight line through the two points described in the table.
On the following graph, use the blue points (circle symbol) to plot the marginal-benefit curve for reading. Next, use the orange points (square symbol)
to plot the marginal-cost curve for reading. Finally, use the black point (plus symbol) to indicate the point corresponding to the efficient amount of
reading (that is, the point at which the net benefits of reading are maximized).
MARGINAL COST, MARGINAL BENEFIT (S per hour of reading per week)
10
12
14
20
10
At any level of reading below the efficient level, the marginal-benefit curve is
v the marginal-cost curve. This means the marginal benefits of
reading are
v than the marginal costs of reading, and therefore, you can increase net benefits by reading for
v hours. On the
other hand, at any level of reading greater than the efficient amount, the marginal-benefit curve is
v the marginal-cost curve. This means
v than the marginal costs of reading, and therefore, you can increase net benefits by reading for
that the marginal benefits of reading are
v hours. Only at the efficient point, where marginal benefits are
v the marginal costs of reading are net benefits
maximized,
On the following graph, use the blue points (circle symbol) to plot the marginal-benefit curve for reading. Next, use the orange points (square symbol)
to plot the marginal-cost curve for reading. Finally, use the black point (plus symbol) to indicate the point corresponding to the efficient amount of
reading (that is, the point at which the net benefits of reading are maximized).
Marginal-Cost Curve
-0-
Marginal-Benefit Curve
Efficient Point
15 20 25
35
40
45 50
30
READING (Hours per week)
Expert Solution
This question has been solved!
Explore an expertly crafted, step-by-step solution for a thorough understanding of key concepts.

This is a popular solution

Trending nowThis is a popular solution!

Step by stepSolved in 2 steps with 1 images

Knowledge Booster


Learn more about
Need a deep-dive on the concept behind this application? Look no further. Learn more about this topic, economics and related others by exploring similar questions and additional content below.Similar questions
- Store Travel Time Each Way (minutes) Price of a Skirt (Dollars per skirt) Local Department Store 15 103 Across Town 30 87 Neighboring City 60 64 Juanita makes $16 an hour at work. She has to take time off work to purchase her skirt, so each hour away from work costs her $16 in lost income. Assume that returning to work takes Juanita the same amount of time as getting to a store and that it takes her 30 minutes to shop. As you answer the following questions, ignore the cost of gasoline and depreciation of her car when traveling. Complete the following table by computing the opportunity cost of Juanita's time and the total cost of shopping at each location. Store Opportunity Cost of Time Price of a Skirt Total Cost (Dollars) (Dollars per skirt) (Dollars) Local Department Store 103 Across Town 87 Neighboring City 64arrow_forwardFor Question 2 there is a typo. It is supposed to say consider Ronald from question 1. Both question 1 and 2 are provided, i would appreciate if someone could complete them as soon as possible. Also this is not a graded question from an exam, it is homework l have been given although l did not purchase the textbook so cant get the solutions for it.arrow_forwardSpecify and explain the typical shapes of marginal-benefit and marginal-cost curves. How are these curves used to determine the optimal allocation of resources to a particular product? If current output is such that marginal cost exceeds marginal benefit, should more or fewer resources be allocated to this product? Explain.arrow_forward
- c) At 700 units of the activity, marginal benefit is $__________ and marginal cost is $__________. d) Subtracting the 700th unit of the activity causes net benefit to __________ (increase, decrease) by $__________.arrow_forwardGraph is necessaryarrow_forwardHours Playing Video Games Total Benefit Marginal Benefit Total Cost Marginal Cost 1 $20 MB1 $7 MC1 $35 MB2 $15 MC2 $45 MB3 $25 MC3 4 $50 MB4 $40 MC4 $53 MB5 $60 MC5 The above table is the same table from question 1. Enter your answer as a whole number and do not write out the number as a word (ie. 6 not "Six") How many hours should this individual spend playing video games? [Hours] 2.arrow_forward
arrow_back_ios
arrow_forward_ios
Recommended textbooks for you
 Principles of Economics (12th Edition)EconomicsISBN:9780134078779Author:Karl E. Case, Ray C. Fair, Sharon E. OsterPublisher:PEARSON
 Engineering Economy (17th Edition)EconomicsISBN:9780134870069Author:William G. Sullivan, Elin M. Wicks, C. Patrick KoellingPublisher:PEARSON
 Principles of Economics (MindTap Course List)EconomicsISBN:9781305585126Author:N. Gregory MankiwPublisher:Cengage Learning
 Managerial Economics: A Problem Solving ApproachEconomicsISBN:9781337106665Author:Luke M. Froeb, Brian T. McCann, Michael R. Ward, Mike ShorPublisher:Cengage Learning
 Managerial Economics & Business Strategy (Mcgraw-...EconomicsISBN:9781259290619Author:Michael Baye, Jeff PrincePublisher:McGraw-Hill Education
Principles of Economics (12th Edition)
Economics
ISBN:9780134078779
Author:Karl E. Case, Ray C. Fair, Sharon E. Oster
Publisher:PEARSON
Engineering Economy (17th Edition)
Economics
ISBN:9780134870069
Author:William G. Sullivan, Elin M. Wicks, C. Patrick Koelling
Publisher:PEARSON
Principles of Economics (MindTap Course List)
Economics
ISBN:9781305585126
Author:N. Gregory Mankiw
Publisher:Cengage Learning
Managerial Economics: A Problem Solving Approach
Economics
ISBN:9781337106665
Author:Luke M. Froeb, Brian T. McCann, Michael R. Ward, Mike Shor
Publisher:Cengage Learning
Managerial Economics & Business Strategy (Mcgraw-...
Economics
ISBN:9781259290619
Author:Michael Baye, Jeff Prince
Publisher:McGraw-Hill Education