A First Course in Probability (10th Edition)
10th Edition
ISBN: 9780134753119
Author: Sheldon Ross
Publisher: PEARSON
expand_more
expand_more
format_list_bulleted
Concept explainers
Question
help me answering this 17 questions in math please. answer only no need for long solutions!

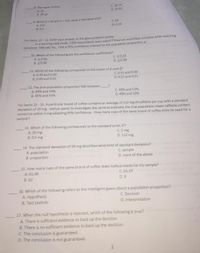
Transcribed Image Text:8. The upper limit is:
C. 29.19
A. 29
D. 29.32
В. 29.15
9. When X =50 and n = 215, what is the value of p?
C. 50
D. 0.23
A. 215
B. 4.3
For items 10- 12. Refer your answer to the given problem below.
In a learning style study, 1200 respondents were asked if they can assimilate concepts while watching
television. 586 said Yes. Find a 95% confidence interval for the population proportion, p.
10. Which of the following are the confidence coefficients?
C. +2.33
D. +2.58
A. +1.96
B. +2.26
11. Which of the following corresponds to the values of p and q?
A. 0.49 and 0.49
C. 0.51 and 0.49
B. 0.49 and 0.51
D. 0.51 and 0.51
12. The true population proportion falls between
A. 44% and 54%
C. 46% and 52%
B. 45% and 53%
D. 48% and 50%
For items 13 - 15. A particular brand of coffee contains an average of 112 mg of caffeine per cup with a standard
deviation of 20 mg. Joshua wants to investigate the same to estimate the true population mean caffeine content
correct to within 5 mg adopting 95% confidence. How many cups of the same brand of coffee does he need for a
sample?
13. Which of the following corresponds to the standard error, E?
A. 20 mg
C. 5 mg
B. 0.5 mg
D. 112 mg
14. The standard deviation of 20 mg describes what kind of standard deviation?
A. population
B. proportion
C. sample
D. none of the above
15. How many cups of the same brand of coffee does Joshua needs for his sample?
A. 61.46
C. 61.47
В. 62
D. 8
16. Which of the following refers to the intelligent guess about a population proportion?
А. Нурothesis
C. Decision
B. Test statistic
D. Interpretation
17. When the null hypothesis is rejected, which of the following is true?
A. There is sufficient evidence to back up the decision.
B. There is no sufficient evidence to back up the decision.
C. The conclusion is guaranteed.
D. The conclusion is not guaranteed.

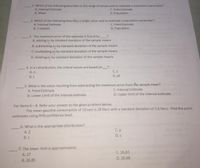
Transcribed Image Text:1. Which of the following describes to the range of values used to estimate a population parameter?
A. Interval Estimate
C. Point Estimate
B. Mean
D. Population
2. Which of the following describes a single value used to estimate a population parameter?
A. Interval Estimate
C. Point Estimate
B. Z statistic
D. Population
3. The maximum error of the estimate is found by
A. adding za by standard deviation of the sample means
B. subtracting za by standard deviation of the sample means
2
C. multiplying za by standard deviation of the sample means
D. dividing za by standard deviation of the sample means
2
4. In a t distribution, the critical values are based on.
A. n
С.z
В. t
D. df
5. What is the value resulting from subtracting the maximum error from the sample mean?
A. Point Estimate
C. Interval Estimate
B. Lower Limit of the interval estimate
D. Upper limit of the interval estimate
For items 6-8. Refer your answer to the given problem below.
The mean gasoline consumption of 10 cars is 28 liters with a standard deviation of 1.6 liters. Find the point
estimates using 95% confidence level.
6. What is the appropriate distribution?
А. Z
В. t
С.р
D. s
7. The lower limit is approximately:
A. 27
В. 26.85
C. 26.81
D. 26.68
Expert Solution
This question has been solved!
Explore an expertly crafted, step-by-step solution for a thorough understanding of key concepts.
This is a popular solution
Trending nowThis is a popular solution!
Step by stepSolved in 3 steps

Knowledge Booster
Learn more about
Need a deep-dive on the concept behind this application? Look no further. Learn more about this topic, probability and related others by exploring similar questions and additional content below.Similar questions
arrow_back_ios
arrow_forward_ios
Recommended textbooks for you
 A First Course in Probability (10th Edition)ProbabilityISBN:9780134753119Author:Sheldon RossPublisher:PEARSON

A First Course in Probability (10th Edition)
Probability
ISBN:9780134753119
Author:Sheldon Ross
Publisher:PEARSON
