Glencoe Algebra 1, Student Edition, 9780079039897, 0079039898, 2018
18th Edition
ISBN: 9780079039897
Author: Carter
Publisher: McGraw Hill
expand_more
expand_more
format_list_bulleted
Question

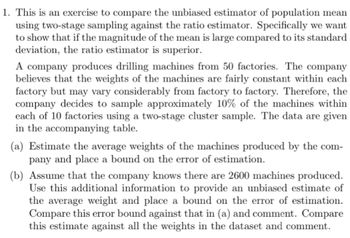
Transcribed Image Text:1. This is an exercise to compare the unbiased estimator of population mean
using two-stage sampling against the ratio estimator. Specifically we want
to show that if the magnitude of the mean is large compared to its standard
deviation, the ratio estimator is superior.
A company produces drilling machines from 50 factories. The company
believes that the weights of the machines are fairly constant within each
factory but may vary considerably from factory to factory. Therefore, the
company decides to sample approximately 10% of the machines within
each of 10 factories using a two-stage cluster sample. The data are given
in the accompanying table.
(a) Estimate the average weights of the machines produced by the com-
pany and place a bound on the error of estimation.
(b) Assume that the company knows there are 2600 machines produced.
Use this additional information to provide an unbiased estimate of
the average weight and place a bound on the error of estimation.
Compare this error bound against that in (a) and comment. Compare
this estimate against all the weights in the dataset and comment.
![Number of
Number of
Number
machines
machines
sampled
1
52
5
2
56
3
60
10
6
6
4
46
5
5
49
5
6
51
5
7
50
5
8
61
6
9
60
6
10
45
6
Weights of
machines
(in kg)
1012, 1011, 1012, 1010, 1013
1010, 1009, 1007, 1009, 1008, 1010
1006, 1005, 1007, 1005, 1006, 1004
1007, 1008, 1007, 1007, 1006
1010, 1011, 1013, 1012, 1012
1014, 1015, 1013, 1012, 1013
1006, 1007, 1006, 1008, 1007
1009, 1010, 1008, 1009, 1009, 1010
1007, 1010, 1008, 1009, 1009, 1010
1012, 1011, 1012, 1013, 1012, 1012
You may find the following R codes and outputs useful.
> M=c (52,56,60,46,49,51,50,61,60,45)
> m=c(5,6,6,5,5,5,5,6,6,6)
> y=matrix(nrow=10, ncol=6,data=0)
> y [1,1:5]=c(12,11,12,10,13)+1000
> y [2,]=c(10,9,7,9,8,10)+1000
> y [3,]=c(6,5,7,5,6,4)+1000
> y [4,1:5]=c(7,8,7,7,6)+1000
> y [5, 1:5]=c(10,11,13,12,12)+1000
> y [6,1:5]=c(14,15,13,12,13)+1000
> y [7,1:5]=c(6,7,6,8,7)+1000
> y [8,]=c(9,10,8,9,9,10)+1000
> y [9,]=c(7,10,8,9,9,10)+1000
> y [10,]=c(12,11,12,13,12,12) +1000
>
> s2=ybar=rep(0, times=10)
> for (i in 1:10){
+yrow=y [i, 1:m[i]]
+ ybar [i]=mean (yrow)
+ s2[i]=var (yrow)
+ }
>
> ybar
[1] 1011.600 1008.833 1005.500 1007.000 1011.600 1013.400 1006.800 1009.167
[9] 1008.833 1012.000
>
[1] 1.3000000 1.3666667 1.1000000 0.5000000 1.3000000 1.3000000 0.7000000
[8] 0.5666667 1.3666667 0.4000000
Zཆ](https://content.bartleby.com/qna-images/question/008f8cce-1e45-43a4-8b17-46721d7357f5/cc53e35c-840a-4de3-8a3e-b54d366674ff/iie7aos_thumbnail.png)
Transcribed Image Text:Number of
Number of
Number
machines
machines
sampled
1
52
5
2
56
3
60
10
6
6
4
46
5
5
49
5
6
51
5
7
50
5
8
61
6
9
60
6
10
45
6
Weights of
machines
(in kg)
1012, 1011, 1012, 1010, 1013
1010, 1009, 1007, 1009, 1008, 1010
1006, 1005, 1007, 1005, 1006, 1004
1007, 1008, 1007, 1007, 1006
1010, 1011, 1013, 1012, 1012
1014, 1015, 1013, 1012, 1013
1006, 1007, 1006, 1008, 1007
1009, 1010, 1008, 1009, 1009, 1010
1007, 1010, 1008, 1009, 1009, 1010
1012, 1011, 1012, 1013, 1012, 1012
You may find the following R codes and outputs useful.
> M=c (52,56,60,46,49,51,50,61,60,45)
> m=c(5,6,6,5,5,5,5,6,6,6)
> y=matrix(nrow=10, ncol=6,data=0)
> y [1,1:5]=c(12,11,12,10,13)+1000
> y [2,]=c(10,9,7,9,8,10)+1000
> y [3,]=c(6,5,7,5,6,4)+1000
> y [4,1:5]=c(7,8,7,7,6)+1000
> y [5, 1:5]=c(10,11,13,12,12)+1000
> y [6,1:5]=c(14,15,13,12,13)+1000
> y [7,1:5]=c(6,7,6,8,7)+1000
> y [8,]=c(9,10,8,9,9,10)+1000
> y [9,]=c(7,10,8,9,9,10)+1000
> y [10,]=c(12,11,12,13,12,12) +1000
>
> s2=ybar=rep(0, times=10)
> for (i in 1:10){
+yrow=y [i, 1:m[i]]
+ ybar [i]=mean (yrow)
+ s2[i]=var (yrow)
+ }
>
> ybar
[1] 1011.600 1008.833 1005.500 1007.000 1011.600 1013.400 1006.800 1009.167
[9] 1008.833 1012.000
>
[1] 1.3000000 1.3666667 1.1000000 0.5000000 1.3000000 1.3000000 0.7000000
[8] 0.5666667 1.3666667 0.4000000
Zཆ
Expert Solution
This question has been solved!
Explore an expertly crafted, step-by-step solution for a thorough understanding of key concepts.
Step by stepSolved in 2 steps

Knowledge Booster
Recommended textbooks for you
 Glencoe Algebra 1, Student Edition, 9780079039897...AlgebraISBN:9780079039897Author:CarterPublisher:McGraw Hill
 Big Ideas Math A Bridge To Success Algebra 1: Stu...AlgebraISBN:9781680331141Author:HOUGHTON MIFFLIN HARCOURTPublisher:Houghton Mifflin Harcourt
 Linear Algebra: A Modern IntroductionAlgebraISBN:9781285463247Author:David PoolePublisher:Cengage Learning

Glencoe Algebra 1, Student Edition, 9780079039897...
Algebra
ISBN:9780079039897
Author:Carter
Publisher:McGraw Hill

Big Ideas Math A Bridge To Success Algebra 1: Stu...
Algebra
ISBN:9781680331141
Author:HOUGHTON MIFFLIN HARCOURT
Publisher:Houghton Mifflin Harcourt

Linear Algebra: A Modern Introduction
Algebra
ISBN:9781285463247
Author:David Poole
Publisher:Cengage Learning