
A First Course in Probability (10th Edition)
10th Edition
ISBN: 9780134753119
Author: Sheldon Ross
Publisher: PEARSON
expand_more
expand_more
format_list_bulleted
Related questions
Concept explainers
Question
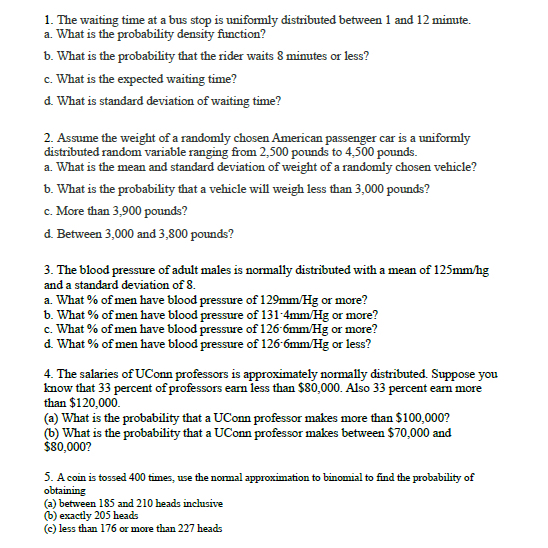

Transcribed Image Text:1. The waiting time at a bus stop is unifomly distributed between 1 and 12 minute.
a. What is the probability density function?
b. What is the probability that the rider waits 8 minutes or less?
c. What is the expected waiting time?
d. What is standard deviation of waiting time?
2. Assume the weight of a randomly chosen American passenger car is a uniformly
distributed random variable ranging from 2,500 pounds to 4,500 pounds.
a. What is the mean and standard deviation of weight of a randomly chosen vehicle?
b. What is the probability that a vehicle will weigh less than 3,000 pounds?
c. More than 3,900 pounds?
d. Between 3,000 and 3,800 pounds?
3. The blood pressure of adult males is normally distributed with a mean of 125mm/hg
and a standard deviation of 8.
a. What % of men have blood pressure of 129mm/Hg or more?
b. What % of men have blood pressure of 131-4mm/Hg or more?
c. What % of men have blood pressure of 126-6mm/Hg or more?
d. What % of men have blood pressure of 126-6mm/Hg or less?
4. The salaries of UConn professors is approximately nomally distrībuted. Suppose you
know that 33 percent of professors earn less than $80,000. Also 33 percent eam more
than $120,000.
(a) What is the probability that a UConn professor makes more than $100,000?
(b) What is the probability that a UConn professor makes between $70,000 and
$80,000?
5. A coin is tossed 400 times, use the normal approximation to binomial to find the probability of
obtaining
(a) between 185 and 210 heads inclusive
(b) exactly 205 heads
(c) less than 176 or more than 227 heads
Expert Solution
This question has been solved!
Explore an expertly crafted, step-by-step solution for a thorough understanding of key concepts.

This is a popular solution

Trending nowThis is a popular solution!

Step by stepSolved in 5 steps

Knowledge Booster


Learn more about
Need a deep-dive on the concept behind this application? Look no further. Learn more about this topic, probability and related others by exploring similar questions and additional content below.Similar questions
- Time spent using e-mail per session is normally distributed, with u = 14 minutes and o = 3 minutes. Assume that the time spent per session is normally distributed. Complete parts (a) through (d). a. If you select a random sample of 25 sessions, what is the probability that the sample mean is between 13.8 and 14.2 minutes? 0.259 (Round to three decimal places as needed.) b. If you select a random sample of 25 sessions, what is the probability that the sample mean is between 13.5 and 14 minutes? 0.297 (Round to three decimal places as needed.) c. If you select a random sample of 100 sessions, what is the probability that the sample mean is between 13.8 and 14.2 minutes? 0.497 (Round to three decimal places as needed.) d. Explain the difference in the results of (a) and (c). Choose the correct answer below. The sample size in (c) is greater than the sample size in (a), so the standard error of the mean (or the standard deviation of the sampling distribution) in (c) is V concentrated…arrow_forwardcompany that owns a large number of grocery stores claims that customers who pay by personal check spend an average of $87 with a standard deviation of $22. Assume the amount spent by these customers is normally distributed. What is the probability that a customer spends more than $100? Express your answer as a decimal rounded to four places after the decimal point.arrow_forwardIn 2008, the per capita consumption of soft drinks in Country A was reported to be 19.28 gallons. Assume that the per capita consumption of soft drinks in Country A is approximately normally distributed, with a mean of 19.28 gallons and a standard deviation of 4 gallons. Complete parts (a) through (d) below. a. What is the probability that someone in Country A consumed more than 15 gallons of soft drinks in 2008? The probability isarrow_forward
- Show all work, including calculator commands 1. The annual per capita consumption of canned vegetables by people in the United States is normally distributed, with a mean of 39 pounds and a standard deviation of 4 pounds. (round to 4 decimal places) a. What is the probability that one randomly selected person consumes more than 42 pounds of canned vegetables? (round to 4 decimal places) b. How many pounds of canned vegetables would a person need to consume to be in the top 5% of annual consumption? (2 decimal places) Determine the probability that a random sample of 25 people has a mean consumption greater than 42 pounds (round to 4 decimal places)arrow_forwardMotorola used the normal distribution to determine the probability of defects and the number of defects expected in a production process. Assume a production process produces items with a mean weight of 8 ounces. a. The process standard deviation is 0.10, and the process control is set at plus or minus 2 standard deviations. Units with weights less than 7.8 or greater than 8.2 ounces will be classified as defects. What is the probability of a defect (to 4 decimals)? In a production run of 1000 parts, how many defects would be found (to the nearest whole number)? b. Through process design improvements, the process standard deviation can be reduced to 0.08. Assume the process control remains the same, with weights less than 7.8 or greater than 8.2 ounces being classified as defects. What is the probability of a defect (to 4 decimals)? In a production run of 1000 parts, how many defects would be found (to the nearest whole number)? c. What is the advantage of reducing process…arrow_forwardThe tread life of Road Stone tires has a normal distribution with a mean of 35,000 miles and a standard deviation of 4,000 miles. a. What proportion of these tires has a tread life of more than 38,000 miles? b. What proportion of these tires has a tread life of less than 32,000 miles? c. What proportion of these tires has a tread life of between 32,000 and 38,000 miles? d. Draw a graph of the probability density function of tread lives, illustrating why the answers to parts (a) and (b) are the same and why the answers to parts (a), (b), and (c) sum to 1.arrow_forward
- Motorola used the normal distribution to determine the probability of defects and the number of defects expected in a production process. Assume a production process produces items with a mean weight of 11 ounces. a. The process standard deviation is 0.10, and the process control is set at plus or minus 1 standard deviation. Units with weights less than 10.9 or greater than 11.1 ounces will be classified as defects. What is the probability of a defect (to 4 decimals)? In a production run of 1,000 parts, how many defects would be found (to the nearest whole number)? b. Through process design improvements, the process standard deviation can be reduced to 0.05. Assume the process control remains the same, with weights less than 10.9 or greater than 11.1 ounces being classified as defects. What is the probability of a defect (to 4 decimals)? In a production run of 1,000 parts, how many defects would be found (to the nearest whole number)? c. What is the advantage of reducing process…arrow_forwardA normal distribution with a mean of O and a standard deviation of 1 is called O a probability density function. O a standard normal distribution. O an ordinary normal curve. none of the other statements is correct.arrow_forward
arrow_back_ios
arrow_forward_ios
Recommended textbooks for you
- A First Course in Probability (10th Edition)ProbabilityISBN:9780134753119Author:Sheldon RossPublisher:PEARSON

A First Course in Probability (10th Edition)
Probability
ISBN:9780134753119
Author:Sheldon Ross
Publisher:PEARSON