
MATLAB: An Introduction with Applications
6th Edition
ISBN: 9781119256830
Author: Amos Gilat
Publisher: John Wiley & Sons Inc
expand_more
expand_more
format_list_bulleted
Related questions
Question
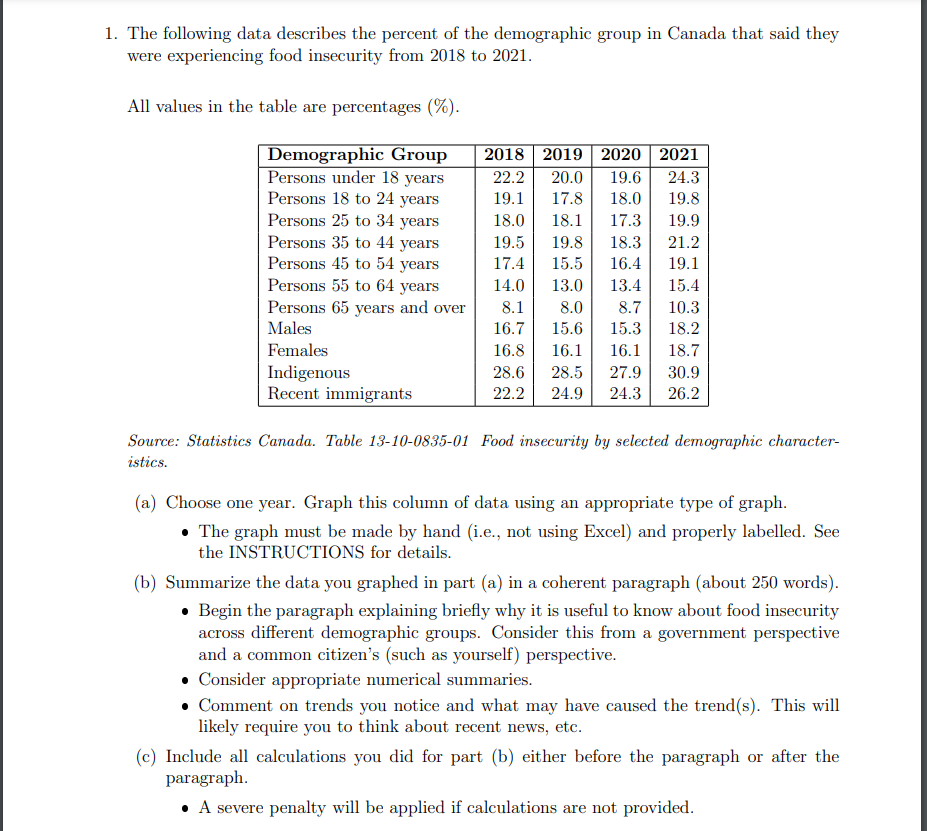

Transcribed Image Text:1. The following data describes the percent of the demographic group in Canada that said they
were experiencing food insecurity from 2018 to 2021.
All values in the table are percentages (%).
Demographic Group
Persons under 18 years
Persons 18 to 24 years
Persons 25 to 34 years
Persons 35 to 44 years
Persons 45 to 54 years
Persons 55 to 64 years
Persons 65 years and over
Males
Females
Indigenous
Recent immigrants
2018 2019 2020 2021
22.2 20.0 19.6 24.3
19.1 17.8 18.0
18.0
19.5
19.8
18.1 17.3
19.9
19.8 18.3
21.2
17.4
15.5 16.4
19.1
14.0
13.0
13.4
15.4
8.1
8.7
10.3
8.0
16.7 15.6 15.3
16.8 16.1 16.1
18.2
18.7
28.6 28.5 27.9
30.9
22.2 24.9 24.3
26.2
Source: Statistics Canada. Table 13-10-0835-01 Food insecurity by selected demographic character-
istics.
(a) Choose one year. Graph this column of data using an appropriate type of graph.
• The graph must be made by hand (i.e., not using Excel) and properly labelled. See
the INSTRUCTIONS for details.
(b) Summarize the data you graphed in part (a) in a coherent paragraph (about 250 words).
• Begin the paragraph explaining briefly why it is useful to know about food insecurity
across different demographic groups. Consider this from a government perspective
and a common citizen's (such as yourself) perspective.
• Consider appropriate numerical summaries.
• Comment on trends you notice and what may have caused the trend(s). This will
likely require you to think about recent news, etc.
(c) Include all calculations you did for part (b) either before the paragraph or after the
paragraph.
• A severe penalty will be applied if calculations are not provided.
SAVE
AI-Generated Solution
info
AI-generated content may present inaccurate or offensive content that does not represent bartleby’s views.
Unlock instant AI solutions
Tap the button
to generate a solution
to generate a solution
Click the button to generate
a solution
a solution
Knowledge Booster

Similar questions
- The number of adult Americans who smoke continues to drop. The table contains estimates of the percentages of adults (ages 1818 and over) who were smokers in the years between 1965 and 201715.and 201715. ???? ?Year � ??????? ?Smokers � 1965 41.94 1970 37.4 1974 37.1 1978 34.1 1980 33.2 1983 32.1 1985 30.1 1987 28.8 1990 25.5 1993 25.0 1995 24.7 1997 24.7 1999 23.5 2001 22.8 2002 22.5 2004 20.9 2006 20.8 2008 20.6 2010 19.3 2012 18.1 2014 16.8 2017 14.0 According to your regression line, how much did smoking decline per year during this period, on the average? Give your answer to three decimal places. average smoking decline: percentage pointsarrow_forwardThe following data, taken from 8 towns in Alberta, are the percentage of residents who are university graduates and the median household incomes (in $ 1000's) for all households in each town. Graduates (%) Median Income ($ 1000) 47.6 34.1 31.5 41.3 34.5 28.1 23.1 20.4 61.7 50.9 57.1 56.4 42.8 42.1 33.2 19.2 Use two-decimal places in your answers. 4 (a) State the slope term and the Y -intercept term of the least squares regression line which attempts to predict the median income of a town in Alberta based on its linear relationship with the percentage of residents who are university graduates. (b) Find the correlation coefficient. (c) As the percenage of university graduates increases by 10%, the median income will change (in $ 1000s) by (make sure you include the positive or negative sign) (d) What percentage of the variation in the variable Median Income is not explained by its linear relationship to the variable Percentage of University Graduates? Use at least one place after the…arrow_forwardWhat is the mode? Answer as an INTEGER. If necessary, round to the nearest integer. If it is not applicable or not available, type “na” instead.arrow_forward
- The following table provides data on access to running water in the home for a certain developing country in 2006. Use the table to find answers to the questions. Have running water in the home Do not have running water in the home 100% People in Urban Areas 90% 78,359,000 3,265,000 People in Rural Areas 18,559,000 7,217,000 What percent of people in that country have running water in the house? Round answers to the nearest percent and include the % sign in your answer. Note that this is the number of the people that have running water (both in rural an urban areas) divided by the total number of people in the country (107,400,000). BZWarrow_forward3. The following tables present the ratings for the top 20 prime time shows for the 2007-2008 season and for the 2017-2018 season. The rating is the percentage of households with TV sets that were turned on during the program. 2007-2008 21.7 15.4 2017-2018 9.7 14.0 10.2 16.1 13.1 10.6 20.8 19.8 15.0 14.2 11.9 11.5 10.4 10.5 16.1 11.6 12.7 15.9 8.2 9.7 12.8 12.6 12.7 9.2 16.6 12.0 12.0 10.8 13.6 11.1 10.9 13.8 9.4 9.2 9.1 9.2 9.0 8.8 A. Use your calculator to find the standard deviation of the 2007-2008 TV ratings (to the hundredths place). C. Compute the range for both seasons. B. Use calculator to find the standard deviation of the 2017-2018 TV ratings (to the hundredths place). 2007-2008 Range_ 2017-2018 Range_ 2A. 2B. D. Use complete sentences to compare the standard deviations and ranges from the two seasons. DO NOT USE DEFINITIONS in your writing. 4. In a poll, respondents were asked if they had ever been in a car accident. 379 respondents indicated that they had been in an…arrow_forwardThe price per share of stock for a sample of 25 companies was recorded at the beginning of the first financial quarter and then again at the end of the first financial quarter. How stocks perform during the first financial quarter is an indicator of what is ahead for the stock market and the economy. Company End of 1st quarter Beginning of 1st quarter Bank of New York Mellon 54.19 53.82 Kraft Foods 55.70 77.02 E.I. du Pont de Nemours and Company 102.57 109.00 Consolidated Edison 79.95 83.58 Johnson & Johnson 126.01 139.23 Union Pacific 132.73 135.78 Comcast 32.06 41.07 Applied Materials 50.91 53.04 Pfizer 35.40 36.44 General Electric 14.05 17.98 AT&T 32.54 38.54 Cisco Systems 44.83 38.86 Home Depot 184.63 188.03 JP Morgan Chase 108.78 107.95 Procter & Gamble 71.96 90.65 Verizon 48.82 53.53 Devon Energy 36.20 42.23 Lilly 79.07 84.68 Microsoft 95.00 85.95 Coca Cola 42.59 45.59 Qualcomm 50.82 65.20 Exxon Mobil Corporation 76.95…arrow_forward
arrow_back_ios
arrow_forward_ios
Recommended textbooks for you
- MATLAB: An Introduction with ApplicationsStatisticsISBN:9781119256830Author:Amos GilatPublisher:John Wiley & Sons Inc
 Probability and Statistics for Engineering and th...StatisticsISBN:9781305251809Author:Jay L. DevorePublisher:Cengage Learning
 Statistics for The Behavioral Sciences (MindTap C...StatisticsISBN:9781305504912Author:Frederick J Gravetter, Larry B. WallnauPublisher:Cengage Learning
  Elementary Statistics: Picturing the World (7th E...StatisticsISBN:9780134683416Author:Ron Larson, Betsy FarberPublisher:PEARSON
 The Basic Practice of StatisticsStatisticsISBN:9781319042578Author:David S. Moore, William I. Notz, Michael A. FlignerPublisher:W. H. Freeman
 Introduction to the Practice of StatisticsStatisticsISBN:9781319013387Author:David S. Moore, George P. McCabe, Bruce A. CraigPublisher:W. H. Freeman
MATLAB: An Introduction with Applications
Statistics
ISBN:9781119256830
Author:Amos Gilat
Publisher:John Wiley & Sons Inc
Probability and Statistics for Engineering and th...
Statistics
ISBN:9781305251809
Author:Jay L. Devore
Publisher:Cengage Learning
Statistics for The Behavioral Sciences (MindTap C...
Statistics
ISBN:9781305504912
Author:Frederick J Gravetter, Larry B. Wallnau
Publisher:Cengage Learning
Elementary Statistics: Picturing the World (7th E...
Statistics
ISBN:9780134683416
Author:Ron Larson, Betsy Farber
Publisher:PEARSON
The Basic Practice of Statistics
Statistics
ISBN:9781319042578
Author:David S. Moore, William I. Notz, Michael A. Fligner
Publisher:W. H. Freeman
Introduction to the Practice of Statistics
Statistics
ISBN:9781319013387
Author:David S. Moore, George P. McCabe, Bruce A. Craig
Publisher:W. H. Freeman