
MATLAB: An Introduction with Applications
6th Edition
ISBN: 9781119256830
Author: Amos Gilat
Publisher: John Wiley & Sons Inc
expand_more
expand_more
format_list_bulleted
Related questions
Question
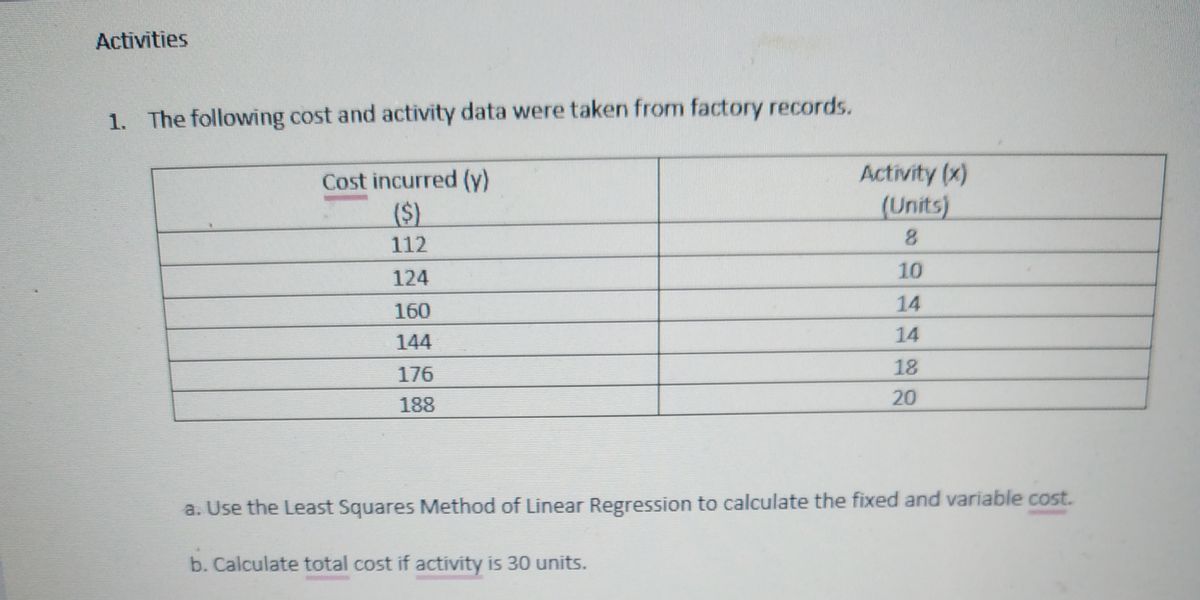

Transcribed Image Text:Activities
1. The following cost and activity data were taken from factory records.
Cost incurred (y)
($)
112
124
160
144
176
188
Activity (x)
(Units)
8
10
14
14
18
20
a. Use the Least Squares Method of Linear Regression to calculate the fixed and variable cost.
b. Calculate total cost if activity is 30 units.
Expert Solution
This question has been solved!
Explore an expertly crafted, step-by-step solution for a thorough understanding of key concepts.

This is a popular solution

Trending nowThis is a popular solution!

Step by stepSolved in 4 steps with 4 images

Knowledge Booster

Similar questions
- Show your work please.arrow_forwardssarrow_forwardWeight (lbs.) 173 184 194 214 168 220 188 188 207 167 217 Systolic Blood Pressure 132 143 153 162 154 168 137 149 159 128 166 1. What is the response variable? 2. What is the explanatory variable? 3. What is the equation of the linear regression line? 4. If person's weight is 150, what can we expect the systolic blood pressure to be?arrow_forward
- $339,380 $41,768 A national homebuilder builds single-family homes and condominium-style townhouses. The accompanying dataset provides information on the selling price, lot cost, and type of home for closings during one month. Complete parts a through c. E Click the icon to view the house sales data a. Develop a multiple regression model for sales price as a function of lot cost and type of home without any interaction term. Create a dummy variable named "Townhouse", where it is equal to 1 when Type = "Townhouse" and 0 otherwise. Determine the coefficients of the regression equation. Sales Price = 108726 + (3.68 ) • Lot Cost + ( - 75063 )• Townhouse (Round the constant and coefficient of Townhouse to the nearest integer as needed. Round all other values to two decimal places as needed.) b. Determine if an interaction exists between lot cost and type of home and find the best model. Use a = 0.1 as the level of significance. First determine whether an interaction exists. Select the…arrow_forwardThe value of a sports franchise is directly related to the amount of revenue that a franchise can generate. The following data represents the value in 2014 (in $millions) and the annual revenue (in $millions) for the 30 Major League Baseball franchises. Suppose you want to develop a simple linear regression model to predict franchise value based on annual revenue generated. Team Revenue Value Baltimore 245 1000 Boston 370 2100 Chicago White Sox 227 975 Cleveland 207 825 Detroit 254 1125 Houston 175 800 Kansas City 231 700 Los Angeles Angels 304 1300 Minnesota 223 895 New York Yankees 508 3200 Oakland 202 725 Seattle 250 1100 Tampa Bay 188 625 Texas 266 1220 Toronto 226 870 Arizona 211 840 Atlanta 267 1150 Chicago Cubs 302 1800 Cincinnati 227 885 Colorado…arrow_forwardThe table below show data that has been collected from different fields from various farms in a certain valley. The table contains the grams of Raspberries tested and the amount of their Vitamin C content in mg. Find a linear model that express Vitamin C content as a function of the weight of the Raspberries. grams 50 60 70 80 90 100 110 Vitamin C content in mg 9.3 14.3 18.9 23.5 27.5 31.7 36.9 A) Find the regression equation: y = places x + Round your answers to 3 decimal B) Answer the following questions using your un-rounded regression equation. If we test 140 grams of raspberries what is the expected Vitamin C content? nearest tenth) mg (round to thearrow_forward
- An important application of regression analysis in accounting is in the estimation of cost. By collecting data on volume and cost and using the least squares method to develop an estimated regression equation relating volume and cost, an accountant can estimate the cost associated with a particular manufacturing volume. Consider the following sample of production volumes and total cost data for a manufacturing operation. Total Cost ($) 3900 4700 5300 5700 6400 7100 The data on the production volume and total cost y for particular manufacturing operation were used to develop the estimated regression equation =-490.00 + 10.60x, a. The company's production schedule shows that 450 units must be produced next month. Predict the total cost for next month. ŷ* = * (to 2 decimals) b. Develop a 99% prediction interval for the total cost for next month. (to 2 decimals) 8 t- value decimals) (to 3 * (to 2 Spred decimals) Prediction Interval for an individual Value next month Ⓡ Production Volume…arrow_forwardThe following table shows the approximate amount of trash produced in an industrialized country from 1980 to 2000. Let x represent the year after 1980 (1980 is year 0) and y represent the amount of trash (millions of tons). Year Million Tons 1980 150 1990 202 2000 220 (a) Draw the graph for this data. (b) Find the equation of the regression line for the data. (Round your answers to one decimal place.)y = x + (c) Use the equation to predict the amount of trash y that will be produced in 2010 and 2015. (Round your answers to one decimal place.) 2010: _______million tons 2015: _______ million tonsarrow_forwardAn automotive sales manager wishes to examine the relationship between age (years) and sales price ($) for used automobiles of a certain brand. The accompanying table contains data for a sample of a certain make and model that were listed for sale at a car shopping website. b. Fit a quadratic regression model to predict price and state the quadratic regression equation.arrow_forward
arrow_back_ios
arrow_forward_ios
Recommended textbooks for you
- MATLAB: An Introduction with ApplicationsStatisticsISBN:9781119256830Author:Amos GilatPublisher:John Wiley & Sons Inc
 Probability and Statistics for Engineering and th...StatisticsISBN:9781305251809Author:Jay L. DevorePublisher:Cengage Learning
 Statistics for The Behavioral Sciences (MindTap C...StatisticsISBN:9781305504912Author:Frederick J Gravetter, Larry B. WallnauPublisher:Cengage Learning
  Elementary Statistics: Picturing the World (7th E...StatisticsISBN:9780134683416Author:Ron Larson, Betsy FarberPublisher:PEARSON
 The Basic Practice of StatisticsStatisticsISBN:9781319042578Author:David S. Moore, William I. Notz, Michael A. FlignerPublisher:W. H. Freeman
 Introduction to the Practice of StatisticsStatisticsISBN:9781319013387Author:David S. Moore, George P. McCabe, Bruce A. CraigPublisher:W. H. Freeman
MATLAB: An Introduction with Applications
Statistics
ISBN:9781119256830
Author:Amos Gilat
Publisher:John Wiley & Sons Inc
Probability and Statistics for Engineering and th...
Statistics
ISBN:9781305251809
Author:Jay L. Devore
Publisher:Cengage Learning
Statistics for The Behavioral Sciences (MindTap C...
Statistics
ISBN:9781305504912
Author:Frederick J Gravetter, Larry B. Wallnau
Publisher:Cengage Learning
Elementary Statistics: Picturing the World (7th E...
Statistics
ISBN:9780134683416
Author:Ron Larson, Betsy Farber
Publisher:PEARSON
The Basic Practice of Statistics
Statistics
ISBN:9781319042578
Author:David S. Moore, William I. Notz, Michael A. Fligner
Publisher:W. H. Freeman
Introduction to the Practice of Statistics
Statistics
ISBN:9781319013387
Author:David S. Moore, George P. McCabe, Bruce A. Craig
Publisher:W. H. Freeman