MATLAB: An Introduction with Applications
6th Edition
ISBN: 9781119256830
Author: Amos Gilat
Publisher: John Wiley & Sons Inc
expand_more
expand_more
format_list_bulleted
Question

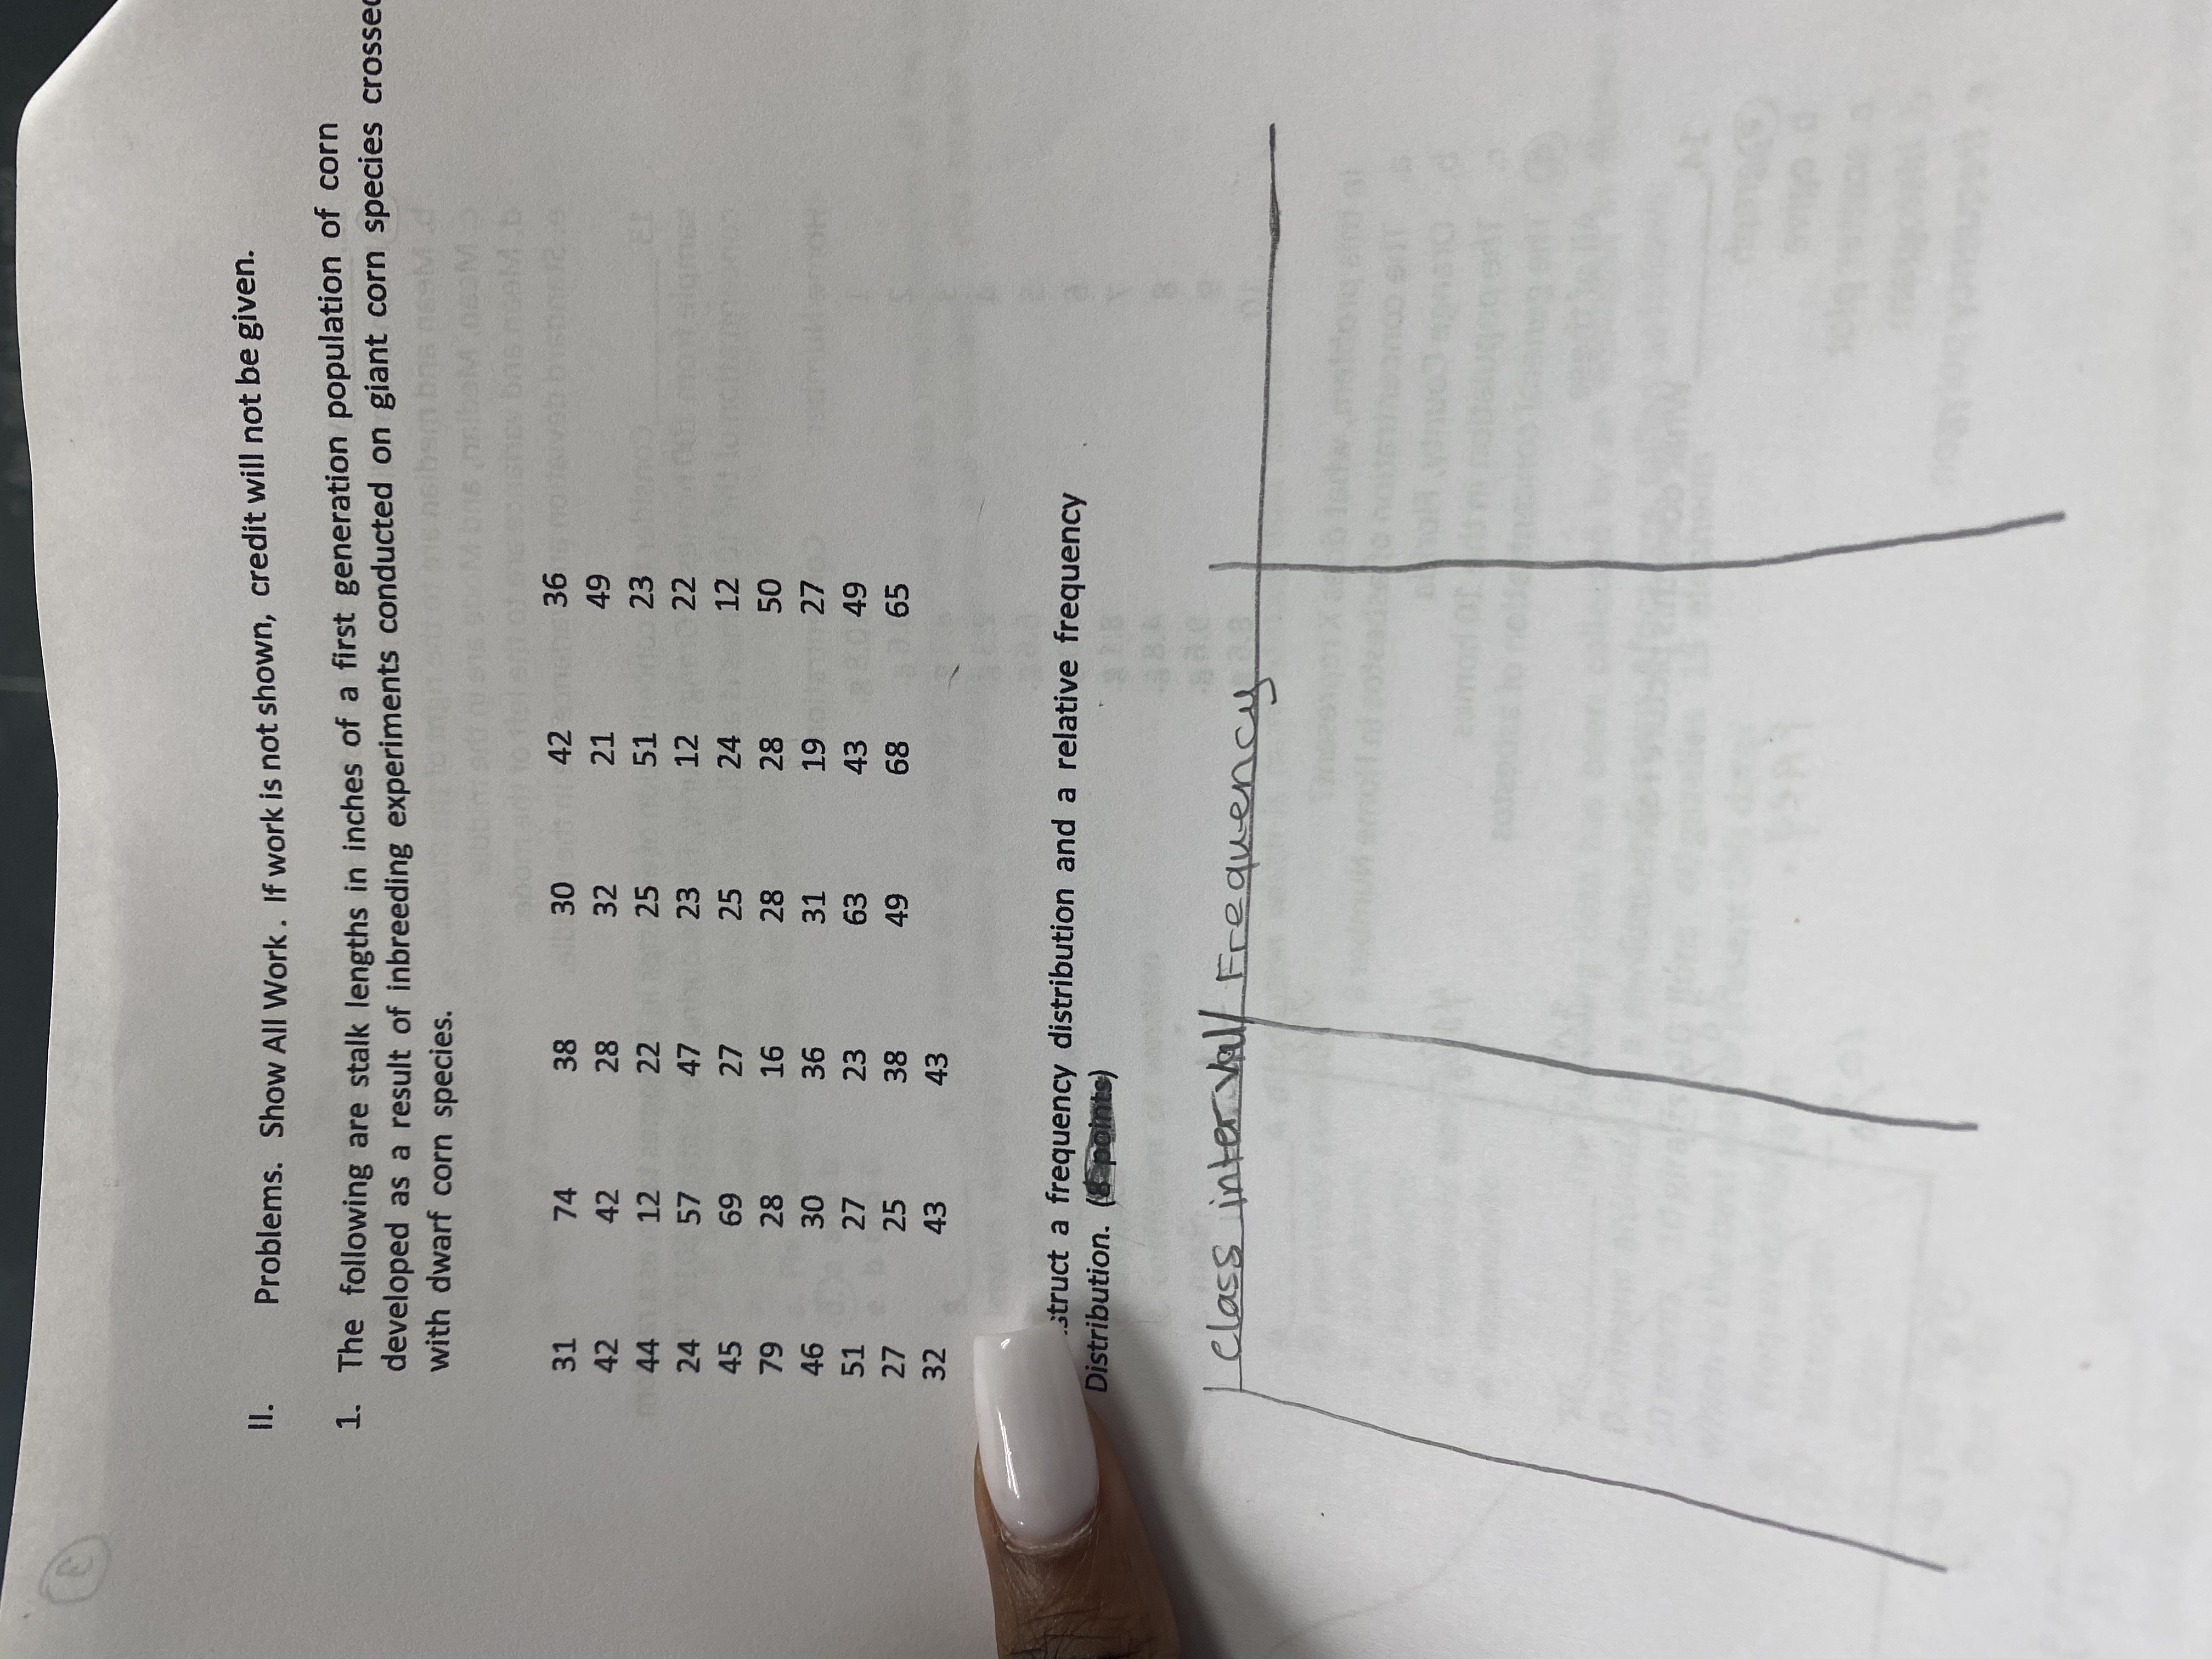
Transcribed Image Text:**Section II: Problems**
**Instructions:** Show all work. If work is not shown, credit will not be given.
**Problem 1:**
The following are stalk lengths in inches of a first-generation population of corn developed as a result of inbreeding experiments conducted on giant corn species crossed with dwarf corn species.
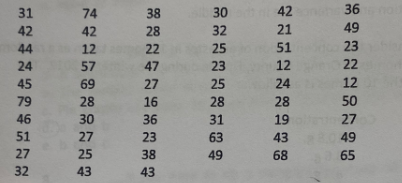
Data:
```
31, 74, 38, 30, 42, 36,
42, 42, 28, 32, 21, 49,
44, 12, 22, 25, 51, 23,
24, 57, 47, 39, 20, 17,
45, 69, 27, 25, 24, 12,
79, 28, 16, 28, 28, 50,
46, 30, 36, 37, 19, 33,
51, 27, 23, 63, 43, 49,
32, 27, 23, 49, 68, 65,
32, 43, 43
```
**Task:**
Construct a frequency distribution and a relative frequency distribution.
**Diagram:**
- **Table Layout:** Two columns titled "Class Interval" and "Frequency."
- There are no entries filled in the table. You will need to determine class intervals and fill in the frequency according to the data provided.
Expert Solution
arrow_forward
Step 1
Given :

Trending nowThis is a popular solution!
Step by stepSolved in 2 steps with 1 images

Knowledge Booster
Similar questions
- The following table gives the cost of household’s electricity bills during the spring months, in dollars. The households are in the same area and are similar in size. The first column represents houses with central air, and the second column represents houses with window units. (Round answers to one decimal place) Central Air Window Unit 32 16 65 87 85 98 100 120 67 42 40 20 70 80 80 90 98 110 70 40 a) The mean for the Central air column is Answer. b) The mean for the Window Unit column is Answer. c) The standard deviation for the Central Air column is Answer. d) The standard deviation for the Window Unit column is Answer.arrow_forward15. Diameter of Douglas Fir Trees The diameter of the Douglas fir tree is measured at a height of 1.37 meters. The S following data represent the diameter in centimeters of a random sample of 12 Douglas firs in the western Washington Cascades. 156 162 147 173 147 190 130 101 159 113 181 109 Source: L. Winter. "Live Tree and Tree-Ring Records to Reconstruct the Structural Development of an Old-Growth Douglas Fir/Western Hemlock Stand in the Western Washington Cascades." Corvallis, OR: Forest Science Data Bank, 2005. (a) Obtain a point estimate for the mean and standard deviation diameter of a Douglas fir tree in the western Washington Cascades. (b) Because the sample size is small, we must verify that the data come from a population that is normally distributed and that the data do not contain any outliers. The figures show the normal probability plot and boxplot. The correlation between the tree diameters and expected z-scores is 0.982. Use Option 1 or Option 2 to determine if the…arrow_forward1.The weight and systolic blood pressure of 26 randomly selected males in the age group 25 to 30 are shown in the following table. Assume that weight and blood pressure are jointly normally distributed. Systolic Systolic Subject Weight ВР Subject Weight ВР 1 165 130 14 172 153 2 167 133 15 159 128 3. 180 150 16 168 132 4 155 128 17 174 149 212 151 18 183 158 6. 175 146 19 215 150 7 190 150 20 195 163 8 210 140 21 180 156 200 148 22 143 124 10 149 125 23 240 170 11 158 133 24 235 165 12 169 135 25 192 160 13 170 150 26 187 159 (a) Find a regression line relating systolic blood pressure to weight. (b) Test for significance of regression using a = 0.05 (c) Estimate the correlation coefficient. LOarrow_forward
- 1. The table below includes the height and weight measurements for a random sample of 18 female Olympic athletes. Second name Edmonds Oyepitan Steryiou Araujo Pinto Moniz Allegrini Jerzyk Height(cm) 172 165 180 169 168 166 162 170 166 162 178 164 172 170 164 167 177 171 Weight (kg) Country/Team 70 Team GB Team GB 57 59 60 62 105 57 58 56 56 68 47 56 49 65 57 80 56 Greece Brazil Brazil Cape Verde Italy Poland Poland Hungary Russian Federation Kazakhstan Team GB Japan Skrzypulec Mohamed Shanaeva Zhexembinova Willmott Hatakeyama Nchout Dawidowicz Matoshka Danson Cameroon Poland Belarus Team GB a) Determine the range and IQR for the height variable (do NOT use Excel for IQR). b) Draw a boxplot for the height variable. Write the values for the lower and upper boundaries on the plot. Are there any outliers in the sample? c) Based on the boxplot, describe the shape of the distribution for the height variable (symmetrical, positively skewed, or negatively skewed)... d) Calculate variance &…arrow_forwardThe following data represents the age of 30 lottery winners. 21 30 31 32 35 35 36 37 37 40 40 43 43 45 46 46 47 49 60 61 64 66 67 67 67 68 71 72 76 80 Complete the frequency distribution for the data. Bin Frequency [20,30) [30,40) [40,50) [50,60) [60,70) [70,80) [80,90)arrow_forwardThe following data represents the age of 30 lottery winners. 26 28 28 30 30 32 33 35 24 37 37 41 43 48 56 58 62 63 64 64 66 68 71 72 72 73 73 76 78 84 Complete the frequency distribution for the data. Bin Frequency [20,30) [30,40) [40,50) [50,60) [60,70) [70,80) [80,90)arrow_forward
arrow_back_ios
arrow_forward_ios
Recommended textbooks for you
 MATLAB: An Introduction with ApplicationsStatisticsISBN:9781119256830Author:Amos GilatPublisher:John Wiley & Sons Inc
 Probability and Statistics for Engineering and th...StatisticsISBN:9781305251809Author:Jay L. DevorePublisher:Cengage Learning
 Statistics for The Behavioral Sciences (MindTap C...StatisticsISBN:9781305504912Author:Frederick J Gravetter, Larry B. WallnauPublisher:Cengage Learning
 Elementary Statistics: Picturing the World (7th E...StatisticsISBN:9780134683416Author:Ron Larson, Betsy FarberPublisher:PEARSON
 The Basic Practice of StatisticsStatisticsISBN:9781319042578Author:David S. Moore, William I. Notz, Michael A. FlignerPublisher:W. H. Freeman
 Introduction to the Practice of StatisticsStatisticsISBN:9781319013387Author:David S. Moore, George P. McCabe, Bruce A. CraigPublisher:W. H. Freeman

MATLAB: An Introduction with Applications
Statistics
ISBN:9781119256830
Author:Amos Gilat
Publisher:John Wiley & Sons Inc

Probability and Statistics for Engineering and th...
Statistics
ISBN:9781305251809
Author:Jay L. Devore
Publisher:Cengage Learning

Statistics for The Behavioral Sciences (MindTap C...
Statistics
ISBN:9781305504912
Author:Frederick J Gravetter, Larry B. Wallnau
Publisher:Cengage Learning

Elementary Statistics: Picturing the World (7th E...
Statistics
ISBN:9780134683416
Author:Ron Larson, Betsy Farber
Publisher:PEARSON

The Basic Practice of Statistics
Statistics
ISBN:9781319042578
Author:David S. Moore, William I. Notz, Michael A. Fligner
Publisher:W. H. Freeman

Introduction to the Practice of Statistics
Statistics
ISBN:9781319013387
Author:David S. Moore, George P. McCabe, Bruce A. Craig
Publisher:W. H. Freeman