MATLAB: An Introduction with Applications
6th Edition
ISBN: 9781119256830
Author: Amos Gilat
Publisher: John Wiley & Sons Inc
expand_more
expand_more
format_list_bulleted
Question

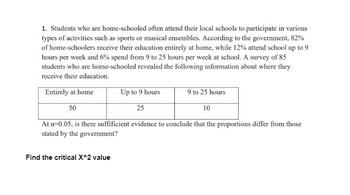
Transcribed Image Text:1. Students who are home-schooled often attend their local schools to participate in various
types of activities such as sports or musical ensembles. According to the government, 82%
of home-schoolers receive their education entirely at home, while 12% attend school up to 9
hours per week and 6% spend from 9 to 25 hours per week at school. A survey of 85
students who are home-schooled revealed the following information about where they
receive their education.
Entirely at home
50
Up to 9 hours
9 to 25 hours
25
10
At a=0.05, is there suffificient evidence to conclude that the proportions differ from those
stated by the government?
Find the critical X^2 value
Expert Solution
This question has been solved!
Explore an expertly crafted, step-by-step solution for a thorough understanding of key concepts.
This is a popular solution
Trending nowThis is a popular solution!
Step by stepSolved in 3 steps with 1 images

Knowledge Booster
Similar questions
- In March 2017, 9,195 men took trips with median duration of 300 seconds, and 2,439 women took trips with median duration of 319 seconds, on New York City's ride sharing program, Citibike. Overall, what was the median duration of all Citibike ride trips that month? A. 304 seconds B. 315 seconds C. 309.5 seconds D. None of these. E. Cannot be determinedarrow_forward. In an upcoming decision to relocate, a new graduate’s decision on location choice comes down to housing prices. The following data are the monthly rental prices for a sample of unfurnished studio apartments in Concord, New Hampshire, and a sample of unfurnished studio apartments in Charleston, West Virginia: Concord$955 $980 $940 $975 $965 $990 $1,240 $1,120Charleston$725 $705 $695 $725 $690 $745 $575 $800a. For each set of data, compute the mean, median, mode, range, standard deviation, and coefficient of variation. b. What conclusions can you draw about unfurnished studio apartments renting in Concord versus Charleston? Compare and contrast.arrow_forwardI need help with number 8, 4, and 5. Thank you so much :)arrow_forward
- As a destination marketing director, you found that TV executives used the guideline that 25% of the viewers were watching Fox cable network, 22% watching NBC and CBS, and 19% watching ABC. The remaining 12% were watching other cable networks such as CNN and MSNBC on a weekday night. A random sample of 500 viewers in the D.C. metro area last Tuesday night showed 109 homes were tuned in to the Fox station, 125 homes tuning in to NBC affiliate, 100 homes tuning in to CBS affiliate and 81 homes tuning in to ABC affiliate. 85 homes were watching CNN and NSNBC cable stations. At the 0.05 significant level, can we conclude that the guideline is still reasonable?arrow_forward3. A mathematics placement test is given to all entering freshmen at a small college. A student who receives a grade below 35 is denied admission to the regular mathematics course and placed in a remedial class. The placement test scores and the final grades for 20 students who took the regular course were recorded as follows: Placement Test Course Grade | Placement Test | Course Grade 50 53 90 54 35 35 41 80 60 91 61 48 40 56 60 71 55 68 60 71 65 36 40 47 35 11 55 53 60 70 50 68 90 79 65 57 35 59 50 79 (a) Plot a scatter diagram. (b) Find the equation of the regression line to predict course grades from placement test scores. (c) Graph the line on the scatter diagram (d) If 60 is the minimum passing grade, below which placement test score should students in the future be denied admission to this course?arrow_forwardHere are some summary statistics for the numbers of hectares of olives and apples harvested per region, for area that planted those crops. In Region A, there were 36 hectares of olives harvested and 18 hectares of Apples harvested. Relative to its crop, which plant had a better harvest? A: They had equally good harvests relative to their crops. B: The Olives. C: It’s impossible to say without seeing all of the harvest amounts. D: The Apples.arrow_forward
arrow_back_ios
arrow_forward_ios
Recommended textbooks for you
 MATLAB: An Introduction with ApplicationsStatisticsISBN:9781119256830Author:Amos GilatPublisher:John Wiley & Sons Inc
 Probability and Statistics for Engineering and th...StatisticsISBN:9781305251809Author:Jay L. DevorePublisher:Cengage Learning
 Statistics for The Behavioral Sciences (MindTap C...StatisticsISBN:9781305504912Author:Frederick J Gravetter, Larry B. WallnauPublisher:Cengage Learning
 Elementary Statistics: Picturing the World (7th E...StatisticsISBN:9780134683416Author:Ron Larson, Betsy FarberPublisher:PEARSON
 The Basic Practice of StatisticsStatisticsISBN:9781319042578Author:David S. Moore, William I. Notz, Michael A. FlignerPublisher:W. H. Freeman
 Introduction to the Practice of StatisticsStatisticsISBN:9781319013387Author:David S. Moore, George P. McCabe, Bruce A. CraigPublisher:W. H. Freeman

MATLAB: An Introduction with Applications
Statistics
ISBN:9781119256830
Author:Amos Gilat
Publisher:John Wiley & Sons Inc

Probability and Statistics for Engineering and th...
Statistics
ISBN:9781305251809
Author:Jay L. Devore
Publisher:Cengage Learning

Statistics for The Behavioral Sciences (MindTap C...
Statistics
ISBN:9781305504912
Author:Frederick J Gravetter, Larry B. Wallnau
Publisher:Cengage Learning

Elementary Statistics: Picturing the World (7th E...
Statistics
ISBN:9780134683416
Author:Ron Larson, Betsy Farber
Publisher:PEARSON

The Basic Practice of Statistics
Statistics
ISBN:9781319042578
Author:David S. Moore, William I. Notz, Michael A. Fligner
Publisher:W. H. Freeman

Introduction to the Practice of Statistics
Statistics
ISBN:9781319013387
Author:David S. Moore, George P. McCabe, Bruce A. Craig
Publisher:W. H. Freeman