
MATLAB: An Introduction with Applications
6th Edition
ISBN: 9781119256830
Author: Amos Gilat
Publisher: John Wiley & Sons Inc
expand_more
expand_more
format_list_bulleted
Related questions
Question
thumb_up100%
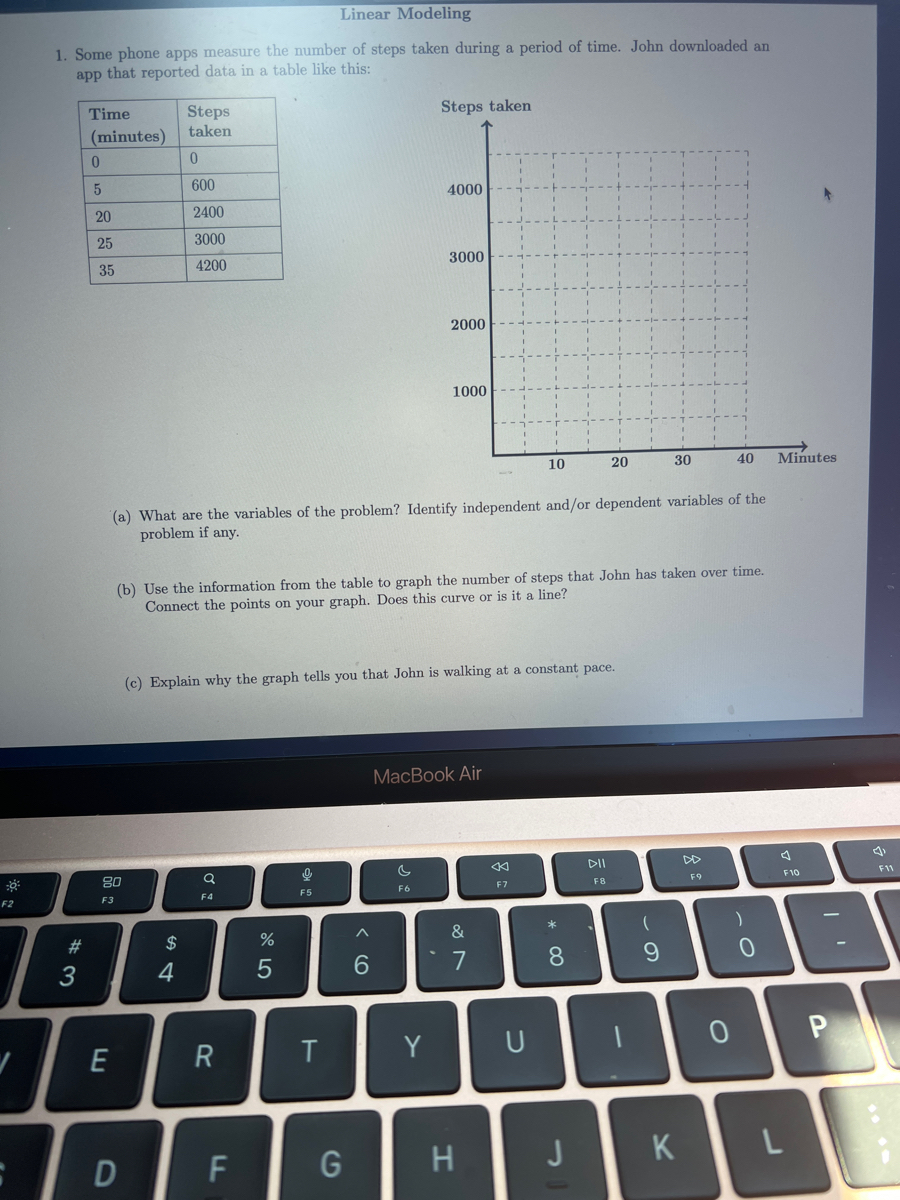

Transcribed Image Text:Linear Modeling
1. Some phone apps measure the number of steps taken during a period of time. John downloaded an
app that reported data in a table like this:
Time
Steps
Steps taken
taken
(minutes)
600
4000
20
2400
25
3000
4200
3000
35
2000
1000
10
20
30
40
Minutes
(a) What are the variables of the problem? Identify independent and/or dependent variables of the
problem if any.
(b) Use the information from the table to graph the number of steps that John has taken over time.
Connect the points on your graph. Does this curve or is it a line?
(c) Explain why the graph tells you that John is walking at a constant pace.
МacВook Air
DII
DD
80
F10
F9
F6
F7
F8
F5
F2
F3
F4
&
23
2$
3
4
5
6.
7
8
9.
E
R
Y
U
F
H
J
K
L.
* 00
Expert Solution
This question has been solved!
Explore an expertly crafted, step-by-step solution for a thorough understanding of key concepts.

Step by stepSolved in 2 steps with 1 images

Knowledge Booster

Similar questions
- Helloarrow_forwardIn recent decades, the percentage of Americans who always wear their seatbelt has been on the rise. The following table contains data[1] between the years 1992 and 2011 (n, number of years after 1992) representing the percentage (P) of Americans who always wear seatbelts. The graph contains a plot of these points along with a “fitted” line, which models (or approximates) the data points. The equation for this line appears below the graph. n 0 4 8 12 16 19 P 70 75 79 83 87 91 P=1.07n+70.28 Estimate the percentage of Americans who always wear their seatbelt for 2002. Explain clearly and completely how you arrived at your answer. Estimate the percentage of Americans who always wear their seatbelt for 2012. Explain clearly and completely how you arrived at your answer. Estimate the percentage of Americans who always wear their seatbelt for 2024. Explain clearly and completely how you arrived at your answer. Comment on the…arrow_forwardWhat type of graph is this, and is it displaying Ordinal, Interval, Nominal, or Ratio Data?arrow_forward
- We'll look at the Galton data frame from the mosaicData package: data(Galton)View(Galton)help(Galton) Here's a scatterplot of the heights of the mothers and the heights of their children: ***(YOU MUST CREATE THE SCATTERPLOT FROM INFO GIVEN) We would like to use the data to predict the height of a child from the height of her mother. As described in class and in the Course Notes, use the predict() function to predict the height of a child (the time of Galtons' study) if the child's mother was known to be 64 inches tall. Record your answer (without units) as a decimal number, correct to at least two decimal places. _______________________arrow_forwardUse the data given in the three scenarios below to produce scatter plots, determine the type of model demonstrated in each example and then answer the questions based on the graph you created. Scenario 1 Rescue 911 In a rural community, fire and paramedic crews must service a large region. They often cover 2 or 3 towns several kilometres apart. These crews travel, on average, 70 km/h to their destination. The Chief of Station 42 wants to determine the time required to reach the patient's home (response time) for his region. The station is located next to the local hospital. The Chief knows the distances to each community that he services, including Deerborn, the furthest community, at 55 km away. Using the data below, create a scatter plot showing the relationship between distance to patient and response time. Distance to Patient (km) Response Time (minutes) 10 8.6 15 12.9 40 34.3 50 42.9 55 47.1arrow_forwarda) Find the equation of the line which is the best fit for the data, with x equal to the number of years after 1999 and y equal to the millions of people b) Ise the model to estimate the number of people who took trips in 2008.arrow_forward
- On its maiden voyage in 1912, the RMS Titanic struck an iceberg and sank in less than three hours. The table shows survival statistics. Survivors Deceased Women and Children 11 Women and Total Category First Class Second Class Third Class Children Men Men 145 54 119 329 285 24 119 142 417 15 104 105 710 69 214 706 685 1517 899 Crew Total 2223 Source: Statistics of Passengers Rescued and Lost, White Star Momentos 1. Create a graph that lawyers could use to help families of the affected passengers. Explain what type of graph you chose and why. 2. The cruise line released a statement with the headline, "Hundreds of Lives Saved in Titanic Mishap." Create a graph or highlight some data that the cruise line could use to justify this headline. 3. Reflect How do the graphs from steps 1 and 2 show that the way in which you represent information can change people's perceptions? 4. Extend Your Understanding Search the Internet for some examples of data displays that are accurate but misrepresent…arrow_forward26 14 30 45 20 21 27 32 40 Age of residents in a neighbourhood 50 9 37 40 36 13 52 10 35 12 36 57 28 51 47 48 42 42 52 1 53 Create a box-and-whisker plot for the data. If you use technology copy and paste the graph into your solutions document. If you prepare it by hand use a ruler and take a clear, well-lit photograph or scan and insert it as an image into your document.arrow_forwardMake a scatterplot of the untransformed data and tell which kind ofrelationship the points seem to follow. Also name the best type oftransformation needed to "straighten" the plot.Note: Part of the transformation shouId involve subtracting 1900 from the year soyou're working with more manageable numbers.Now try some transformations to get the data as close to linear as possible.(Use your calculator to transform the data, and try scatterplots of the differenttransformations). Then find the regression line, r, and r2.Tell which transformation worked the best and back it up by showing:• A scatterplot of the transformed data with the least-squares regression equation andline, r, and r-squared.• A plot of the original data with the regression equation converted to a non-linearequationarrow_forward
- The table gives the projections of the population, in millions, of a country's residents over age 16 for selected years from 2015 to 2060. Answer parts (a) through (e). Year 2015 2020 2025 2030 2035 a. Graph the data, with y equal to the population in millions and x equal to the number of years after 2010. Choose the correct graph below. All graphs have viewing window [0, 60] by [0, 400] with Xscl = 5 and Yscl = 50. OA. O B. Q Q Population (millions) 255.161 266.024 276.558 286.967 297.259 MooBook Air O C. b. Find a linear function that models the data, with y equal to the population in millions and x equal to the number of years after 2010. y=x+ (Type integers or decimals rounded to three decimal places as needed.) c. Graph the model and the data on the same axes and comment on the fit of the model to the data. Choose the correct graph below. All graphs have viewing window [0, 60] by [0, 400] with Xscl = 5 and Yscl = 50. OA. OB. G O C. Year 2040 2045 2050 2055 2060 O D. O D.…arrow_forwardWhat type of graph would you use to depict the relationship between: Is the number of days in the Intensive Care Unit(ICU LOS) related to gender? If ICU LOS were two different variables and one was coded as categorical and the other as continuous, would you use the same graph to depict the relationship between the variables? For example: 1. # of days in ICU(as a continuous variable) and gender.. 2. # of days in ICU(as a categorical variable) and gender. Would you use the same graph for numbers 1 and 2? Which graphs would you choose?arrow_forwardI need help with this problemarrow_forward
arrow_back_ios
SEE MORE QUESTIONS
arrow_forward_ios
Recommended textbooks for you
- MATLAB: An Introduction with ApplicationsStatisticsISBN:9781119256830Author:Amos GilatPublisher:John Wiley & Sons Inc
 Probability and Statistics for Engineering and th...StatisticsISBN:9781305251809Author:Jay L. DevorePublisher:Cengage Learning
 Statistics for The Behavioral Sciences (MindTap C...StatisticsISBN:9781305504912Author:Frederick J Gravetter, Larry B. WallnauPublisher:Cengage Learning
  Elementary Statistics: Picturing the World (7th E...StatisticsISBN:9780134683416Author:Ron Larson, Betsy FarberPublisher:PEARSON
 The Basic Practice of StatisticsStatisticsISBN:9781319042578Author:David S. Moore, William I. Notz, Michael A. FlignerPublisher:W. H. Freeman
 Introduction to the Practice of StatisticsStatisticsISBN:9781319013387Author:David S. Moore, George P. McCabe, Bruce A. CraigPublisher:W. H. Freeman
MATLAB: An Introduction with Applications
Statistics
ISBN:9781119256830
Author:Amos Gilat
Publisher:John Wiley & Sons Inc
Probability and Statistics for Engineering and th...
Statistics
ISBN:9781305251809
Author:Jay L. Devore
Publisher:Cengage Learning
Statistics for The Behavioral Sciences (MindTap C...
Statistics
ISBN:9781305504912
Author:Frederick J Gravetter, Larry B. Wallnau
Publisher:Cengage Learning
Elementary Statistics: Picturing the World (7th E...
Statistics
ISBN:9780134683416
Author:Ron Larson, Betsy Farber
Publisher:PEARSON
The Basic Practice of Statistics
Statistics
ISBN:9781319042578
Author:David S. Moore, William I. Notz, Michael A. Fligner
Publisher:W. H. Freeman
Introduction to the Practice of Statistics
Statistics
ISBN:9781319013387
Author:David S. Moore, George P. McCabe, Bruce A. Craig
Publisher:W. H. Freeman