
Glencoe Algebra 1, Student Edition, 9780079039897, 0079039898, 2018
18th Edition
ISBN: 9780079039897
Author: Carter
Publisher: McGraw Hill
expand_more
expand_more
format_list_bulleted
Related questions
Topic Video
Question
Site images for background.
Is there evidence that Bathrooms adds important information to a model that already includes Square feet and Price/Square Feet? Use output to justify your answer.
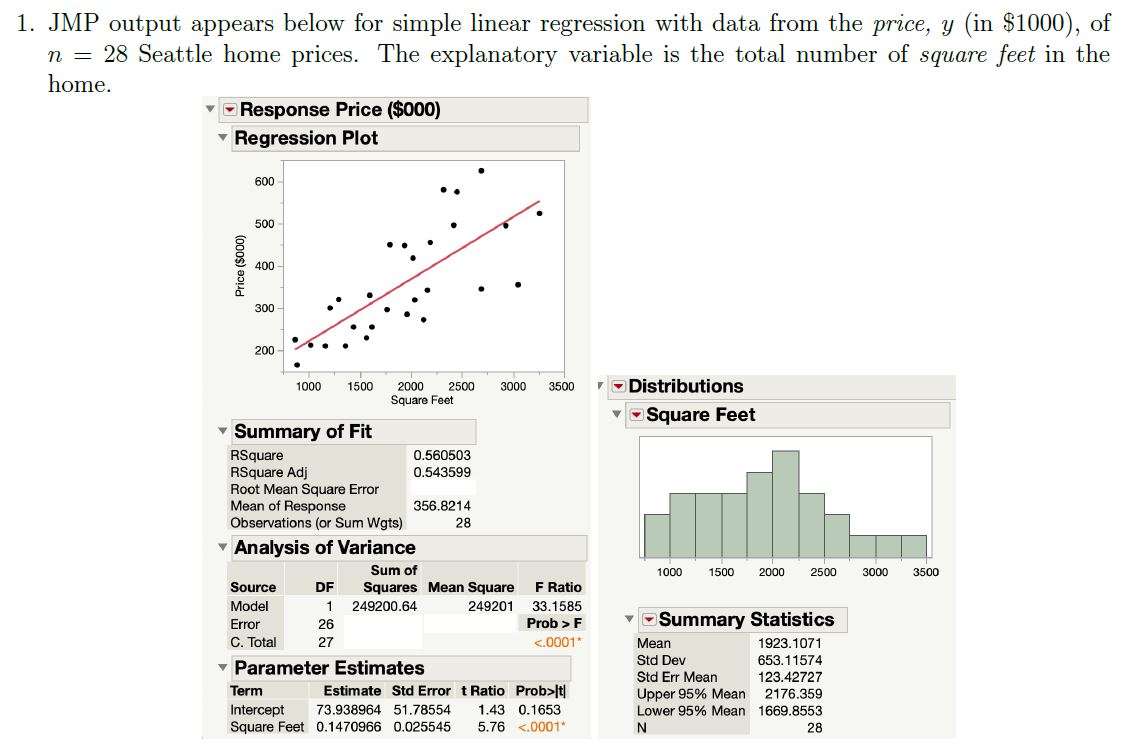

Transcribed Image Text:1. JMP output appears below for simple linear regression with data from the price, y (in $1000), of
n = 28 Seattle home prices. The explanatory variable is the total number of square feet in the
home.
VOResponse Price ($000)
v Regression Plot
600
500
400
300
200
1000
1500
2000
2500
3000
3500
DDistributions
Square Feet
Square Feet
Summary of Fit
RSquare
RSquare Adj
Root Mean Square Error
Mean of Response
Observations (or Sum Wgts)
0.560503
0.543599
356.8214
28
v Analysis of Variance
Sum of
1000
1500
2000
2500
3000
3500
Source
DF
Squares Mean Square
F Ratio
Model
249200,64
249201
33.1585
Prob > F
Summary Statistics
Error
26
C. Total
27
<.0001*
Mean
1923.1071
653,11574
123.42727
Std Dev
- Parameter Estimates
Std Err Mean
Term
Estimate Std Error t Ratio Prob>lt|
Upper 95% Mean
Lower 95% Mean 1669.8553
2176.359
1.43 0.1653
Intercept
Square Feet 0.1470966 0.025545
73.938964 51.78554
5.76 <.0001"
28
Price ($000)
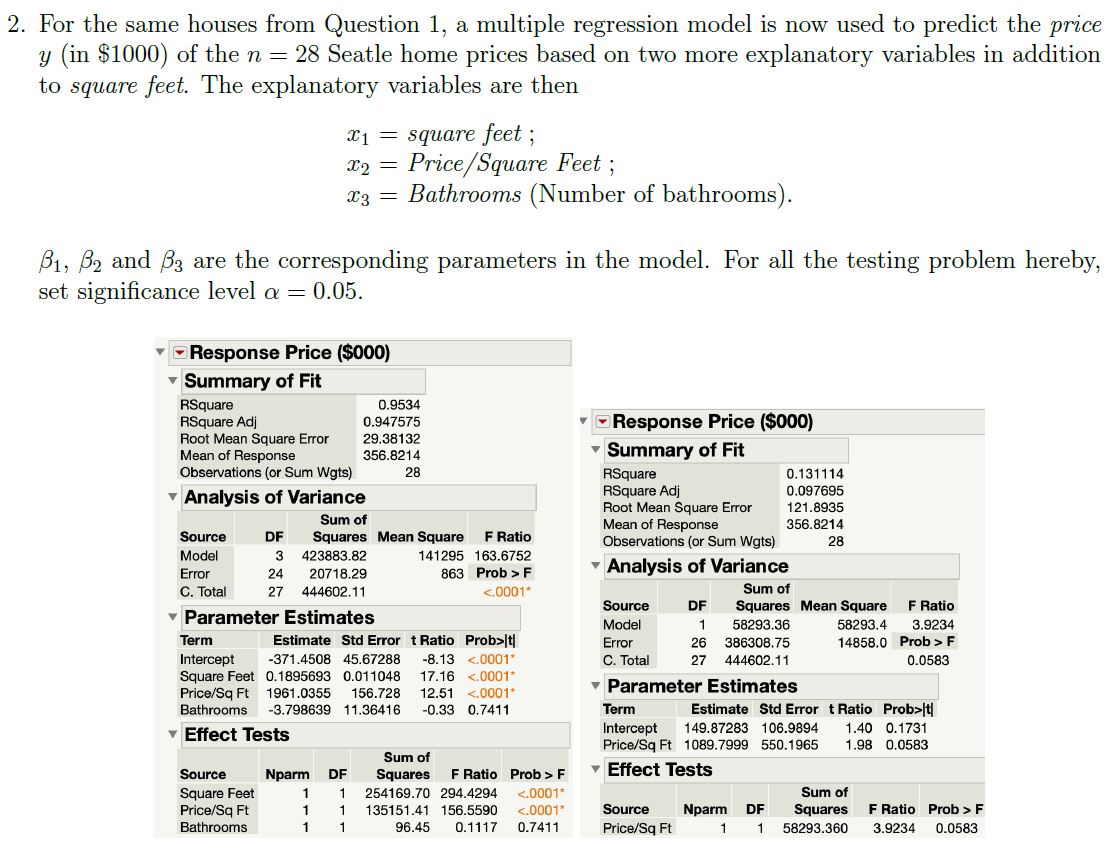
Transcribed Image Text:2. For the same houses from Question 1, a multiple regression model is now used to predict the price
y (in $1000) of the n = 28 Seatle home prices based on two more explanatory variables in addition
to square feet. The explanatory variables are then
X1 = square feet ;
Price/Square Feet;
Bathrooms (Number of bathrooms).
B1, B2 and B3 are the corresponding parameters in the model. For all the testing problem hereby,
set significance level a = 0.05.
Response Price ($000)
Summary of Fit
RSquare
RSquare Adj
Root Mean Square Error
Mean of Response
Observations (or Sum Wgts)
0.9534
0.947575
29.38132
Response Price ($000)
Summary of Fit
356.8214
28
RSquare
RSquare Adj
Root Mean Square Error
Mean of Response
Observations (or Sum Wgts)
0.131114
0.097695
v Analysis of Variance
121.8935
Sum of
356.8214
Source
DF
Squares Mean Square
F Ratio
28
Model
423883.82
141295 163.6752
Analysis of Variance
Error
24
20718.29
863 Prob > F
C. Total
27
444602.11
<.0001*
Sum of
Source
DF
Squares Mean Square
F Ratio
v Parameter Estimates
Model
58293.36
58293.4
3.9234
Term
Estimate Std Error t Ratio Prob>|t|
14858.0 Prob > F
0.0583
Error
26
386308.75
C. Total
Intercept
Square Feet 0.1895693 0.011048
Price/Sq Ft
-371.4508 45.67288
-8.13 <.0001*
27
444602.11
17.16 <.0001*
v Parameter Estimates
12.51 <.0001*
-0.33 0.7411
1961.0355
156.728
Bathrooms
-3.798639 11.36416
Term
Estimate Std Error t Ratio Prob>|t|
Intercept
Price/Sq Ft 1089.7999 550.1965
v Effect Tests
149.87283 106.9894
1.40 0.1731
1.98 0.0583
Sum of
Nparm
F Ratio Prob > F
Effect Tests
Source
DF
Squares
Square Feet
Price/Sq Ft
Bathrooms
254169.70 294.4294
<.0001*
Sum of
135151.41 156.5590
<.0001*
Source
Nparm
DF
Squares
F Ratio Prob > F
1
96.45
0.1117
0.7411
Price/Sq Ft
58293.360
3.9234
0.0583
Expert Solution
This question has been solved!
Explore an expertly crafted, step-by-step solution for a thorough understanding of key concepts.

This is a popular solution

Trending nowThis is a popular solution!

Step by stepSolved in 3 steps with 1 images

Knowledge Booster


Learn more about
Need a deep-dive on the concept behind this application? Look no further. Learn more about this topic, statistics and related others by exploring similar questions and additional content below.Similar questions
- Does Table 1 represent a linear function? If so, finda linear equation that models the data.arrow_forwardWhat is regression analysis? Describe the process of performing regression analysis on a graphing utility.arrow_forwardDemand for Candy Bars In this problem you will determine a linear demand equation that describes the demand for candy bars in your class. Survey your classmates to determine what price they would be willing to pay for a candy bar. Your survey form might look like the sample to the left. a Make a table of the number of respondents who answered yes at each price level. b Make a scatter plot of your data. c Find and graph the regression line y=mp+b, which gives the number of respondents y who would buy a candy bar if the price were p cents. This is the demand equation. Why is the slope m negative? d What is the p-intercept of the demand equation? What does this intercept tell you about pricing candy bars? Would you buy a candy bar from the vending machine in the hallway if the price is as indicated. Price Yes or No 50 75 1.00 1.25 1.50 1.75 2.00arrow_forward
- High School Graduates The following table shows the number, in millions, graduating from high school in the United States in the given year. Year Number graduating in millions 1985 2.83 1987 2.65 1989 2.47 1991 2.29 a. By calculating difference, show that these data can be modeled using a linear function. b. What is the slope for the linear function modeling high school graduations? Explain in practical terms the meaning of the slope. c. Find a formula for a linear function that models these data. d. Express, using functional notation, the number graduating from high school in 1994, and then use your formula from part c to calculate that value.arrow_forwardLife Expectancy The following table shows the average life expectancy, in years, of a child born in the given year42 Life expectancy 2005 77.6 2007 78.1 2009 78.5 2011 78.7 2013 78.8 a. Find the equation of the regression line, and explain the meaning of its slope. b. Plot the data points and the regression line. c. Explain in practical terms the meaning of the slope of the regression line. d. Based on the trend of the regression line, what do you predict as the life expectancy of a child born in 2019? e. Based on the trend of the regression line, what do you predict as the life expectancy of a child born in 1580?2300arrow_forwardCan the average rate of change of a function be constant?arrow_forward
- Nikularrow_forwardType the regression equation for “Area” and “Biomass” in context into your document. Interpret the slope of the regression line (in context of this data set) for “Area” and “Biomass”. is it meaningful to interpret the y-intercept for “Area” and “Biomass”? Why or why not?arrow_forwardA microcomputer manufacturer has developed a regression model relating his sales (y=$10,000s) with three independent variables. The three independent variables are price per unit(Price in $100s), advertising( ADV in $1000s) and the number of product lines (Lines). Part of the regression results is shown below. Coefficient Standard Error Intercept 1.0211 22.8752 Price(X1) -0.1524 0.1411 ADV (X2) 0.8849 0.2886 Lines(X3) -0.1463 1.5340 Source d.f. S.S. Regression 3 2708.61 Error 14 2840.51 Total 17 5549.12 What has been the sample size (n) for this analysis? Use the above results to find the estimated multiple…arrow_forward
- please assistarrow_forwardLouis Katz, a cost accountant at Papalote Plastics, Inc. (PPI), is analyzing the manufacturing costs of a molded plastic telephone handset produced by PPI. Louis's independent variable is production lot size (in 1,000's of units), and his dependent variable is the total cost of the lot (in $100's). Regression analysis of the data yielded the following tables. Coefficients Standard Error t Statistic p-value Intercept 3.996 1.161268 3.441065 0.004885 x 0.358 0.102397 3.496205 0.004413 Source df SS MS F Se = 0.898 Regression 1 9.858769 9.858769 12.22345 r2 = 0.526341 Residual 11 8.872 0.806545 Total 12 18.73077 Using a = 0.05, Louis should ________________.arrow_forwardWhich of the variables is the indepenent variable and dependent variable for the following question. fit a simple linear regression model to predict latitudes using average monthly range lat= latitudes range= the average monthly range between mean montly maximum and minimum temperatures for a selected set of US cities.arrow_forward
arrow_back_ios
SEE MORE QUESTIONS
arrow_forward_ios
Recommended textbooks for you
- Glencoe Algebra 1, Student Edition, 9780079039897...AlgebraISBN:9780079039897Author:CarterPublisher:McGraw Hill
 Algebra & Trigonometry with Analytic GeometryAlgebraISBN:9781133382119Author:SwokowskiPublisher:Cengage

 Algebra and Trigonometry (MindTap Course List)AlgebraISBN:9781305071742Author:James Stewart, Lothar Redlin, Saleem WatsonPublisher:Cengage Learning
 College AlgebraAlgebraISBN:9781305115545Author:James Stewart, Lothar Redlin, Saleem WatsonPublisher:Cengage Learning
Glencoe Algebra 1, Student Edition, 9780079039897...
Algebra
ISBN:9780079039897
Author:Carter
Publisher:McGraw Hill
Algebra & Trigonometry with Analytic Geometry
Algebra
ISBN:9781133382119
Author:Swokowski
Publisher:Cengage
Algebra and Trigonometry (MindTap Course List)
Algebra
ISBN:9781305071742
Author:James Stewart, Lothar Redlin, Saleem Watson
Publisher:Cengage Learning
College Algebra
Algebra
ISBN:9781305115545
Author:James Stewart, Lothar Redlin, Saleem Watson
Publisher:Cengage Learning