
ENGR.ECONOMIC ANALYSIS
14th Edition
ISBN: 9780190931919
Author: NEWNAN
Publisher: Oxford University Press
expand_more
expand_more
format_list_bulleted
Related questions
Question
1.1
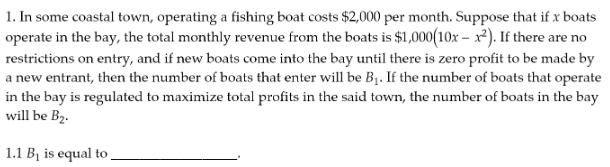

Transcribed Image Text:1. In some coastal town, operating a fishing boat costs $2,000 per month. Suppose that if x boats
operate in the bay, the total monthly revenue from the boats is $1,000(10x - x²). If there are no
restrictions on entry, and if new boats come into the bay until there is zero profit to be made by
a new entrant, then the number of boats that enter will be B₁. If the number of boats that operate
in the bay is regulated to maximize total profits in the said town, the number of boats in the bay
will be B₂.
1.1 B₁ is equal to
Expert Solution
This question has been solved!
Explore an expertly crafted, step-by-step solution for a thorough understanding of key concepts.

This is a popular solution

Trending nowThis is a popular solution!

Step by stepSolved in 3 steps

Knowledge Booster


Learn more about
Need a deep-dive on the concept behind this application? Look no further. Learn more about this topic, economics and related others by exploring similar questions and additional content below.Similar questions
- Each term (3 months) the current group of economics students completed a questionnaire as to how much they would spend on new purchases compared to how much they would save/pay off bills, if they suddenly and unexpectedly received a check for $1,000. The average MPC is shown in the table below. Month in which student poll was taken Average of students’ responses as MPC March 0.41 June 0.30 September 0.22 December 0.56 What do these MPC’s imply about the students’ thinking over the course of the year? (Enter response here.) What is likely happening in the economy during the same period of time?arrow_forwardhelp please answer in text form with proper workings and explanation for each and every part and steps with concept and introduction no AI no copy paste remember answer must be in proper format with all workingarrow_forwardGreenhouse gases trap heat and make the planet warmer. Human activities are responsible for almost all of the increase in greenhouse gases in the atmosphere over the last 150 years. In this part, you will draw two pie graphs. A pie graph is used to show how a certain quantity has been divided into several parts, as well as to show the comparisons among these parts. 1. The data table below shows the total U.S. greenhouse gas emissions by economic sector in 2013, in million metric tons of CO2. On the pie graph provided, complete the graph to show the percent of greenhouse gas emissions for each economic sector. Label each section of the pie graph with its economic sector. The percent for "Agriculture" has been drawn and labeled for you. Economic Sector Electricity Transportation Industry Commercial & Residential Agriculture Percent of Greenhouse Gas Emissions 31 27 21 12 9 80 75 70- 85 65 95 90 wlad Percent 0 100 Agri- culture 55 50 45 10 40 35 20 25 30arrow_forward
- Suppose you are shopping online for a new toy for your dog. As you look at the product reviews, you see the following distribution of ratings. Use this table for questions 2-5. Stars 5 4 3 st 2 IN 1 Frequency 9 3 2 1 5arrow_forwardAssign the figure with the correct correlation coefficients. Possible coefficients: 0.99, 0.58, -0.10, -0.63 Graph A 14 12- 10- 14 Graph B 12- 8- 10- 8. 0- 4- -2 -4- -6- -8 0- 4 8. 14 Graph C 12- 2 Graph D 10- 8- -2- 6- -4- 4- -6- 24 -8- -10- 8 2. 642arrow_forward(Ch7) If the mean time between in-flight aircraft engine shutdowns is 12,500 operating hours, what is the 90 percentile on the distribution of the number of hours until the next shutdown? (hint: convert the mean time between events to the mean events per hour λ, then apply inverse exponential) Question 7Select one: a. 20,180 hours b. 18,724 hours c. 23,733 hours d. 28,782 hoursarrow_forward
- How would you describe a correlation of -1? Group of answer choices There is a perfect linear relationship between x and y. There is a strong positive relationship between x and y. There is no relationship between x and y. There is a weak negative relationship between x and y. thanksarrow_forwarduse the data to compute the probability that an adult in the tri state region smokes kentucky 47 176 indiana 32 134 ohio 39 182 total 118 492arrow_forward3. Use the following joint distribution to compute E(X), E(Y), o, o, oxy, and corr(X, Y). Y=0 X=0 X=1 Total 0.15 0.07 0.22 0.78 Y=1 0.15 0.63 Total 0.30 0.70 1.00arrow_forward
- Refer to the table below aw 1 Year 1950 1960 1970 1980 1990 2000 2010 2020 Participation Rates (Age 16 and Older) Men 864 83.3 79.7 77.4 76.4 74.7 71.2 69.2 Women 33.9 37.7 43.3 51.5 57.5 60.0 58.6 57.4 Instructions: Round your responses to one decimal place. If you are entering any negative numbers be sure to include a negative sign (-) in front of those numbers. Between 1980 and 2020, by how many percentage points did the labor force participation rate of a. men change? b. women change? T Q Search W Oarrow_forwardIf Cov(X,Y) = 639, then what is Cov(19X,10Y)? Suppose Cov(X,Y) = 43. What is Cov(0.23X, 0.33Y)? Suppose Cov(X,Y) = 872. What is Cov(0.99X, 0.86Y)?arrow_forward
arrow_back_ios
arrow_forward_ios
Recommended textbooks for you
 Principles of Economics (12th Edition)EconomicsISBN:9780134078779Author:Karl E. Case, Ray C. Fair, Sharon E. OsterPublisher:PEARSON
 Engineering Economy (17th Edition)EconomicsISBN:9780134870069Author:William G. Sullivan, Elin M. Wicks, C. Patrick KoellingPublisher:PEARSON
 Principles of Economics (MindTap Course List)EconomicsISBN:9781305585126Author:N. Gregory MankiwPublisher:Cengage Learning
 Managerial Economics: A Problem Solving ApproachEconomicsISBN:9781337106665Author:Luke M. Froeb, Brian T. McCann, Michael R. Ward, Mike ShorPublisher:Cengage Learning
 Managerial Economics & Business Strategy (Mcgraw-...EconomicsISBN:9781259290619Author:Michael Baye, Jeff PrincePublisher:McGraw-Hill Education
Principles of Economics (12th Edition)
Economics
ISBN:9780134078779
Author:Karl E. Case, Ray C. Fair, Sharon E. Oster
Publisher:PEARSON
Engineering Economy (17th Edition)
Economics
ISBN:9780134870069
Author:William G. Sullivan, Elin M. Wicks, C. Patrick Koelling
Publisher:PEARSON
Principles of Economics (MindTap Course List)
Economics
ISBN:9781305585126
Author:N. Gregory Mankiw
Publisher:Cengage Learning
Managerial Economics: A Problem Solving Approach
Economics
ISBN:9781337106665
Author:Luke M. Froeb, Brian T. McCann, Michael R. Ward, Mike Shor
Publisher:Cengage Learning
Managerial Economics & Business Strategy (Mcgraw-...
Economics
ISBN:9781259290619
Author:Michael Baye, Jeff Prince
Publisher:McGraw-Hill Education