
MATLAB: An Introduction with Applications
6th Edition
ISBN: 9781119256830
Author: Amos Gilat
Publisher: John Wiley & Sons Inc
expand_more
expand_more
format_list_bulleted
Related questions
Question
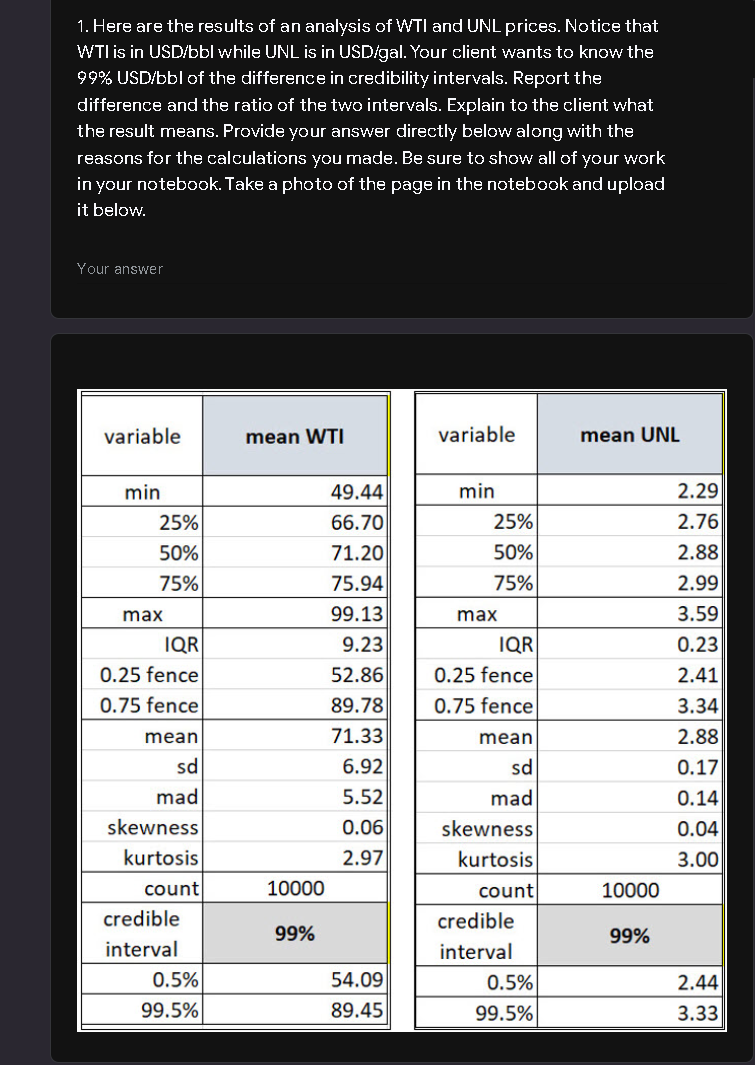

Transcribed Image Text:1. Here are the results of an analysis of WTI and UNL prices. Notice that
WTI is in USD/bbl while UNL is in USD/gal. Your client wants to know the
99% USD/bbl of the difference in credibility intervals. Report the
difference and the ratio of the two intervals. Explain to the client what
the result means. Provide your answer directly below along with the
reasons for the calculations you made. Be sure to show all of your work
in your notebook. Take a photo of the page in the notebook and upload
it below.
Your answer
variable
mean WTI
variable
mean UNL
min
49.44
min
2.29
25%
66.70
25%
2.76
50%
71.20
50%
2.88
75%
75.94
75%
2.99
max
99.13
max
3.59
IQR
9.23
IQR
0.23
0.25 fence
52.86
0.25 fence
2.41
0.75 fence
89.78
0.75 fence
3.34
mean
71.33
mean
2.88
sd
6.92
sd
0.17
mad
5.52
mad
0.14
skewness
0.06
skewness
0.04
kurtosis
2.97
kurtosis
3.00
count
10000
count
10000
credible
credible
99%
99%
interval
interval
0.5%
54.09
0.5%
2.44
99.5%
89.45
99.5%
3.33
Expert Solution
This question has been solved!
Explore an expertly crafted, step-by-step solution for a thorough understanding of key concepts.

Step by stepSolved in 2 steps with 2 images

Knowledge Booster

Similar questions
- true or false: If a 90% CI for the difference between two means is calculated to be [ 6.2, 9.6] then in words this is interpreted as the 90% of the time the true population difference in means will be between 6.2 and 9.6arrow_forwardQ3. Please answer fill-ins.arrow_forwardA major software company is considering a price increase on its most popular product. They are currently selling below their competitor’s price. Someone from the Brand team suggested they check consumer response before making a price increase. You are called into explain how this marketing research might be carried out. In terms of qualitative and quantitative options you tell them...arrow_forward
- Suppose the correlation between height and weight for adults is +0.40.What proportion (or percent) of the variability in weight can be explained by the relationship with height?arrow_forwardANSWER THE LAST 2 QUESTIONS PLEASEarrow_forwardyour car is more crowded than you think. table 5.8 reports results from a 1969 personal transportation survey on "home-to-work" trips in metropolitan areas. The survey stated that the average car occupancy was 1.4 people. check that calculation.arrow_forward
arrow_back_ios
arrow_forward_ios
Recommended textbooks for you
- MATLAB: An Introduction with ApplicationsStatisticsISBN:9781119256830Author:Amos GilatPublisher:John Wiley & Sons Inc
 Probability and Statistics for Engineering and th...StatisticsISBN:9781305251809Author:Jay L. DevorePublisher:Cengage Learning
 Statistics for The Behavioral Sciences (MindTap C...StatisticsISBN:9781305504912Author:Frederick J Gravetter, Larry B. WallnauPublisher:Cengage Learning
  Elementary Statistics: Picturing the World (7th E...StatisticsISBN:9780134683416Author:Ron Larson, Betsy FarberPublisher:PEARSON
 The Basic Practice of StatisticsStatisticsISBN:9781319042578Author:David S. Moore, William I. Notz, Michael A. FlignerPublisher:W. H. Freeman
 Introduction to the Practice of StatisticsStatisticsISBN:9781319013387Author:David S. Moore, George P. McCabe, Bruce A. CraigPublisher:W. H. Freeman
MATLAB: An Introduction with Applications
Statistics
ISBN:9781119256830
Author:Amos Gilat
Publisher:John Wiley & Sons Inc
Probability and Statistics for Engineering and th...
Statistics
ISBN:9781305251809
Author:Jay L. Devore
Publisher:Cengage Learning
Statistics for The Behavioral Sciences (MindTap C...
Statistics
ISBN:9781305504912
Author:Frederick J Gravetter, Larry B. Wallnau
Publisher:Cengage Learning
Elementary Statistics: Picturing the World (7th E...
Statistics
ISBN:9780134683416
Author:Ron Larson, Betsy Farber
Publisher:PEARSON
The Basic Practice of Statistics
Statistics
ISBN:9781319042578
Author:David S. Moore, William I. Notz, Michael A. Fligner
Publisher:W. H. Freeman
Introduction to the Practice of Statistics
Statistics
ISBN:9781319013387
Author:David S. Moore, George P. McCabe, Bruce A. Craig
Publisher:W. H. Freeman