MATLAB: An Introduction with Applications
6th Edition
ISBN: 9781119256830
Author: Amos Gilat
Publisher: John Wiley & Sons Inc
expand_more
expand_more
format_list_bulleted
Question
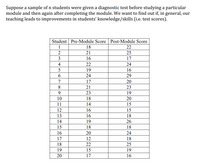
Suppose a sample of n students were given a diagnostic test before studying a particular module and then again after completing the module. We want to find out if, in general, our teaching leads to improvements in students' knowledge/skills (i.e. test scores).
Analyze the data in two different ways: in question 1, please treat the data from the Pre-Module Scores and the data from the Post-Module scores as independent data; that is, do no pair them.
For question 2, you will repeat the analysis, but with the data paired.

Transcribed Image Text:Suppose a sample of n students were given a diagnostic test before studying a particular
module and then again after completing the module. We want to find out if, in general, our
teaching leads to improvements in students' knowledge/skills (i.e. test scores).
Student Pre-Module Score Post-Module Score
1
18
22
2
21
25
3
16
17
4
22
24
5
19
16
24
29
17
20
8.
21
23
23
19
10
18
20
11
14
15
12
16
15
13
16
18
14
19
26
15
18
18
16
20
24
17
12
18
18
22
25
19
15
19
20
17
16
670

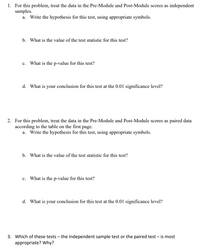
Transcribed Image Text:1. For this problem, treat the data in the Pre-Module and Post-Module scores as independent
samples.
Write the hypothesis for this test, using appropriate symbols.
a.
b. What is the value of the test statistic for this test?
What is the p-value for this test?
с.
d. What is your conclusion for this test at the 0.01 significance level?
2. For this problem, treat the data in the Pre-Module and Post-Module scores as paired data
according to the table on the first page.
a. Write the hypothesis for this test, using appropriate symbols.
b. What is the value of the test statistic for this test?
c. What is the p-value for this test?
d. What is your conclusion for this test at the 0.01 significance level?
3. Which of these tests – the independent sample test or the paired test – is most
appropriate? Why?
Expert Solution
This question has been solved!
Explore an expertly crafted, step-by-step solution for a thorough understanding of key concepts.
This is a popular solution
Trending nowThis is a popular solution!
Step by stepSolved in 4 steps with 2 images

Knowledge Booster
Similar questions
- Studies indicate that excessive noise at night can affect weight gain. One study of n = 127 rats compared the weight gain of rats exposed to excessive noise at night and the weight gain of rats in a quiet night environment. Sample statistics for the study are given in the table below. Use this information to determine if there is significant evidence that weight gain of rats exposed to excessive noise at night is different on average than weight gain of rats in a quiet night environment. Excessive noise at night environment (Group 1) Quiet night environment (Group 2) Sample mean (grams) 22.4 19.9 Sample standard deviation (grams) 6.4 3.8 Observations/Sample size 69 58 Is this a one-tailed or a two-tailed test? Explain in one or two sentences.arrow_forwardA graduate student is interested in how viewing different types of scenes affects working memory. For his study, he selects a random sample of 36 adults. The subjects complete a series of working memory tests before and after walking in an urban setting. Before the walk, the mean score on the test of working memory was 9.1. After the walk, the mean score was 1.4 higher. The graduate student has no presupposed assumptions about how viewing different types of scenes affects working memory, so he formulates the null and alternative hypotheses as: H00 : μDD = 0 H11 : μDD ≠ 0 Assume that the data satisfy all of the required assumptions for a repeated-measures t test. The graduate student calculates the following statistics for his hypothesis test: Mean difference (MDD) 1.4 Estimated population standard deviation of the differences (s) 1.6 Estimated standard error of the mean differences (sMDMD) 0.2667 Degrees of freedom (df) 35 The t statistic 5.25 The critical values of t…arrow_forwardWe are interested in analysing the effect of the lockout laws introduced in some areas of the Sydney CBD and nearby surrounds on the number of alcohol-related violent incidents. Suppose we have two samples of data on the number of violent incidents in a number of local areas of the Sydney CBD and nearby surrounds. Pubs, hotels and clubs located in a subset of these areas became subject to the lockout laws when they were introduced in 2014. The first sample is from 2010 before the introduction of the lockout laws, and the second is from 2015 after the introduction of the law. The hypothesis we wish to test is that the introduction of the lockout laws reduces violent incidents in the areas in which the lockout laws were put in place. We use a difference-in-difference model on the pooled data from 2010 and 2015. We find the following results: viol_inc hat = 33.21 (5.29) + 12.43lockout (7.01) – 4.19Yr2015 (2.98) – 3.32 (lockout x Yr2015) (1.85) N = 181, R^2 = 0.128 Where: viol_incis the…arrow_forward
- Researchers investigate how the presence of cell phones influence the quality of human interaction. Subjects are randomly selected from a population and divided into an experimental group that is asked to leave their phones in the front of the room and a control group that are not asked to leave their cell phones at the front of the room. Subjects are left alone for 10 minutes and then asked to take a survey designed to measure quality of interactions they had with others in the experiment. What statistical test is appropriate?arrow_forwardAt BYU-Idaho there has been a lot of interest in the performance of students in online classes. Generally, administrators are interested to know if there is a difference in the learning of students who take an online course compared to those who take a traditional course. A study was done to see if the grade received in the course is related to the type of course. Researchers collected the grades of randomly selected students who were taking a traditional Business Statistics class and compared those with the grades earned by randomly selected students who were taking an online Business Statistics class. The data are shown in the table below. Grade A B с D F You want to determine if a student's grade and the type of course he or she is enrolled in are independent. Use a level of significance of a = 0.01. State the null and alternative hypothesis for this test. O Ho: Traditional and online courses are not independent. H₂: Traditional and online courses are independent. O Ho: Traditional…arrow_forwardAcne is a common skin disease that affects most adolescents and can continue into adulthood. A study compared the effectiveness of three acne treatments and a placebo, all in gel form, applied twice daily for 12 weeks. The study's 517 teenage volunteers were randomly assigned to one of the four treatments. Success was assessed as clear or almost clear skin at the end of the 12 week period. The results of the study can be seen in the table below. Using the appropriate statistical test, determine if there is significant evidence that the four treatments perform differently. If so, how do they compare.arrow_forward
- Let's use SPSS to run a one-sample t-test! Imagine that you are interested in whether the number of hours students in a statistics course work each week differs from the average number of hours reported by the general student body at ASU. Thankfully, you have a data set that consists of information from students in a statistics course, including how many hours they work each week ("workhours"). You also happen to know that the average number of hours worked each week by the general student population at ASU is 25. Use the data provided to conduct a one sample t-test in SPSS comparing the sample data to the population mean.. The dependent variable for your test should be "workhours". Based on your output, the average number of hours worked each week by a sample is ________ . Enter your answer rounded to two decimal places (i.e., 10.01, not 10.1, not 10.0, not 10.010).arrow_forwardWhich of these experimental designs has the most statistical power (is more likely to show a true difference between 2 treatment conditions)? A. Between-Subjects B. Descriptive Study C. Correlational Study D. Within-Subjectsarrow_forwardA certain virus affects 0.7% of the population. A test used to detect the virus in a person is positive 87% of the time if the person has the virus (true positive) and 14% of the time if the person does not have the virus (false positive). Fill out the remainder of the following table and use it to answer the two questions below based on a total sample of 100,000 people. Virus No Virus TotalPositive Test Negative Test Total 100,000a) Find the probability that a person has the virus given that they have tested positive. Round your answer to the nearest hundredth of a percent and do not include a percent sign. % b) Find the probability that a person does not have the virus given that they test negative. Round your answer to the nearest hundredth of a percent and do not include a percent sign. %arrow_forward
- A father is concerned that his teenage son is watching too much television each day, since his son watches an average of 2 hours per day His son says that his TV habits are no different than those of his friends. Since this father has taken a stats class, he knows that can actually test to see whether or not his son is watching more TV than his peers The father collects a random sample of watching times from boys at his son's high school and gets the following data: 1.9, 2.3, 2.2, 1.9, 1.6, 2.6, 1.4, 2.0, 2.0, 2.2 Find a 95% confidence interval for the true mean number of hours teenagers at that school watch TV. a. Confidence Interval b. Conclusionarrow_forwardPlease help me I tried multiple times, but still getting it wrongarrow_forward
arrow_back_ios
arrow_forward_ios
Recommended textbooks for you
 MATLAB: An Introduction with ApplicationsStatisticsISBN:9781119256830Author:Amos GilatPublisher:John Wiley & Sons Inc
 Probability and Statistics for Engineering and th...StatisticsISBN:9781305251809Author:Jay L. DevorePublisher:Cengage Learning
 Statistics for The Behavioral Sciences (MindTap C...StatisticsISBN:9781305504912Author:Frederick J Gravetter, Larry B. WallnauPublisher:Cengage Learning
 Elementary Statistics: Picturing the World (7th E...StatisticsISBN:9780134683416Author:Ron Larson, Betsy FarberPublisher:PEARSON
 The Basic Practice of StatisticsStatisticsISBN:9781319042578Author:David S. Moore, William I. Notz, Michael A. FlignerPublisher:W. H. Freeman
 Introduction to the Practice of StatisticsStatisticsISBN:9781319013387Author:David S. Moore, George P. McCabe, Bruce A. CraigPublisher:W. H. Freeman

MATLAB: An Introduction with Applications
Statistics
ISBN:9781119256830
Author:Amos Gilat
Publisher:John Wiley & Sons Inc

Probability and Statistics for Engineering and th...
Statistics
ISBN:9781305251809
Author:Jay L. Devore
Publisher:Cengage Learning

Statistics for The Behavioral Sciences (MindTap C...
Statistics
ISBN:9781305504912
Author:Frederick J Gravetter, Larry B. Wallnau
Publisher:Cengage Learning

Elementary Statistics: Picturing the World (7th E...
Statistics
ISBN:9780134683416
Author:Ron Larson, Betsy Farber
Publisher:PEARSON

The Basic Practice of Statistics
Statistics
ISBN:9781319042578
Author:David S. Moore, William I. Notz, Michael A. Fligner
Publisher:W. H. Freeman

Introduction to the Practice of Statistics
Statistics
ISBN:9781319013387
Author:David S. Moore, George P. McCabe, Bruce A. Craig
Publisher:W. H. Freeman