
MATLAB: An Introduction with Applications
6th Edition
ISBN: 9781119256830
Author: Amos Gilat
Publisher: John Wiley & Sons Inc
expand_more
expand_more
format_list_bulleted
Related questions
Topic Video
Question
Solve these questions using the data table below please
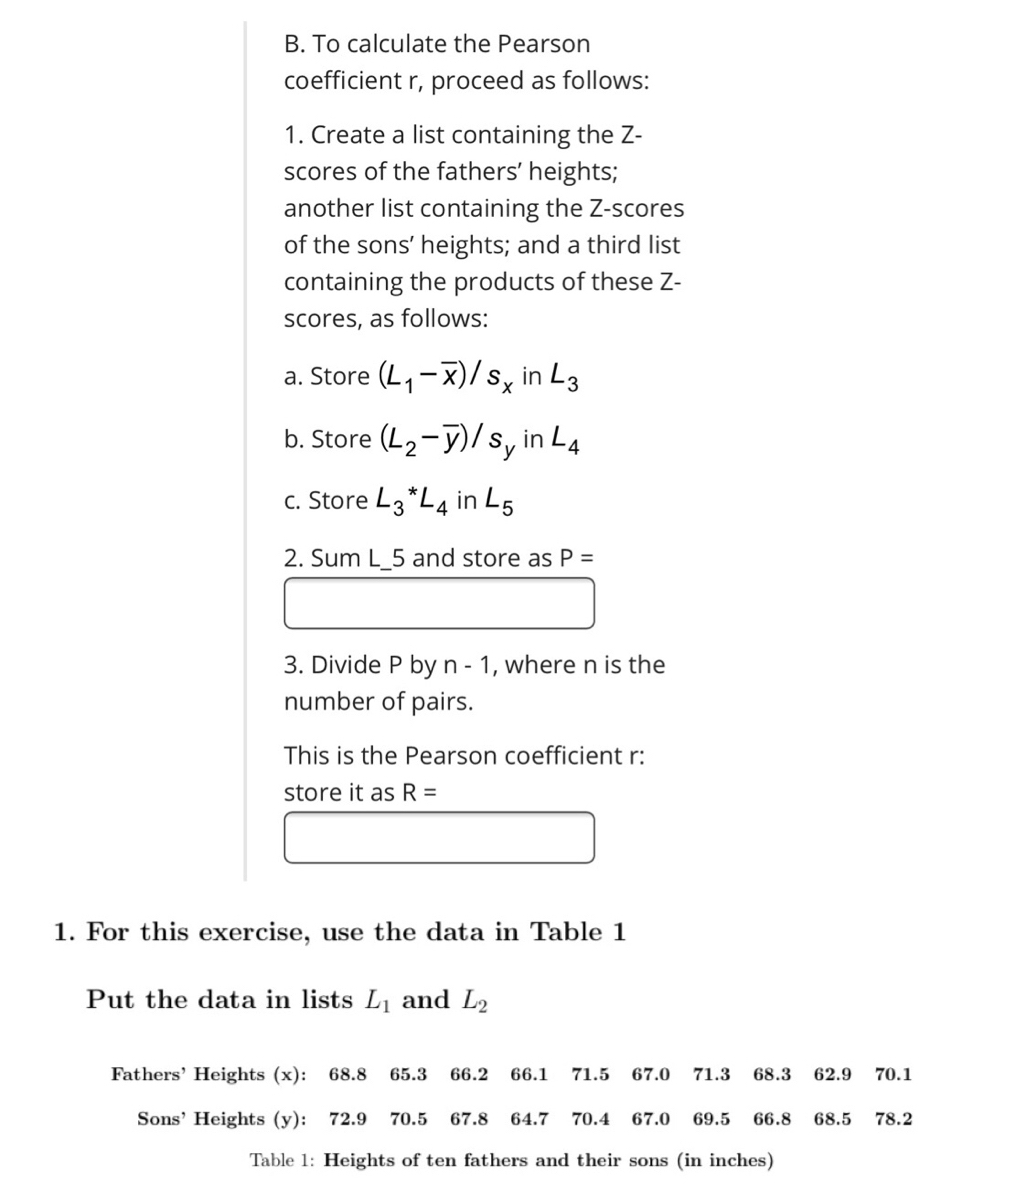

Transcribed Image Text:B. To calculate the Pearson
coefficient r, proceed as follows:
1. Create a list containing the Z-
scores of the fathers' heights;
another list containing the Z-scores
of the sons' heights; and a third list
containing the products of these Z-
Scores, as follows:
a. Store (L, -X)/ s, in L3
b. Store (L2-y)/s, in L4
c. Store L3 *L4 in L5
2. Sum L_5 and store as P =
3. Divide P byn - 1, where n is the
number of pairs.
This is the Pearson coefficient r:
store it as R =
1. For this exercise, use the data in Table 1
Put the data in lists L and L2
Fathers' Heights (x): 68.8
65.3
66.2
66.1
71.5
67.0
71.3
68.3
62.9
70.1
Sons' Heights (y): 72.9
70.5
67.8
64.7
70.4
67.0
69.5
66.8
68.5
78.2
Table 1: Heights of ten fathers and their sons (in inches)
Expert Solution
This question has been solved!
Explore an expertly crafted, step-by-step solution for a thorough understanding of key concepts.

Step by stepSolved in 2 steps

Knowledge Booster


Learn more about
Need a deep-dive on the concept behind this application? Look no further. Learn more about this topic, statistics and related others by exploring similar questions and additional content below.Similar questions
- Mode can be more than one in a data set but medium cannot be.explainarrow_forwardplease answer in text form and in proper format answer with must explanation , calculation for each part and steps clearlyarrow_forwardHere is the data to solve these 3 question. Please give me all this 3 questions answer.arrow_forward
- Please complete all work in excel. Use excel to make any necessary calculations and be sure to identify the answer, including units (if necessary). Answers that need formulas must have them within the answer cell. A manager is trying to educate employees on the effects of personal health and workplace performance. The manager has gathered data from a group of employees to evaluate the effects of sleep and sickness. The manager asked employees to record the total number of hours of sleep they had over 10 working days in two weeks and compared it to the number of sick days that each took over those 10 days. Sick Days Total hours of sleep 0 80 2 40 1 60 0 70 3 50 2 90 4 35 1 68 0 72 2 55 The manager wonders if a non-linear model is a better relationship between the variables. Develop the model and run a regression adding the non-linear variable for total hours of sleep.arrow_forwardThe basketball coach at a local college believes that his team scores more points at home games when more people show up. Below is a list of all home games last year with scores and corresponding attendance. Use Excel, SPSS, or work by hand to show your work finding r. Show your work on the attached pages. Score Attendance Score Attendance 54 380 67 410 57 350 78 215 59 320 67 113 80 478 56 250 82 451 85 450 75 250 101 489 73 489 99 472 53 451 What is the obtained t-score for this correlation? What is the critical t-score for a two-tailed test with a = 0.05? Is this correlation significant based on the t-scores?arrow_forwardList the most important data types. &tell Two example for Eacharrow_forward
- For some data, we know the range R of the data is 12 and its median is 6. Find Estimated Lowest Number, and Estimated Highest Number for this data. Give you answers in the same order asked.arrow_forwardThe list shows the score of each game completed at a bowling alley during a one-hour period. 90, 96, 120, 124, 130, 135, 138, 140, 145, 148, 290, 290 Would the mode of the data be an informative measure of center in this situation? Explain your answer.arrow_forwardThe value(s) that occurs most frequently in a data set is called thearrow_forward
arrow_back_ios
SEE MORE QUESTIONS
arrow_forward_ios
Recommended textbooks for you
- MATLAB: An Introduction with ApplicationsStatisticsISBN:9781119256830Author:Amos GilatPublisher:John Wiley & Sons Inc
 Probability and Statistics for Engineering and th...StatisticsISBN:9781305251809Author:Jay L. DevorePublisher:Cengage Learning
 Statistics for The Behavioral Sciences (MindTap C...StatisticsISBN:9781305504912Author:Frederick J Gravetter, Larry B. WallnauPublisher:Cengage Learning
  Elementary Statistics: Picturing the World (7th E...StatisticsISBN:9780134683416Author:Ron Larson, Betsy FarberPublisher:PEARSON
 The Basic Practice of StatisticsStatisticsISBN:9781319042578Author:David S. Moore, William I. Notz, Michael A. FlignerPublisher:W. H. Freeman
 Introduction to the Practice of StatisticsStatisticsISBN:9781319013387Author:David S. Moore, George P. McCabe, Bruce A. CraigPublisher:W. H. Freeman
MATLAB: An Introduction with Applications
Statistics
ISBN:9781119256830
Author:Amos Gilat
Publisher:John Wiley & Sons Inc
Probability and Statistics for Engineering and th...
Statistics
ISBN:9781305251809
Author:Jay L. Devore
Publisher:Cengage Learning
Statistics for The Behavioral Sciences (MindTap C...
Statistics
ISBN:9781305504912
Author:Frederick J Gravetter, Larry B. Wallnau
Publisher:Cengage Learning
Elementary Statistics: Picturing the World (7th E...
Statistics
ISBN:9780134683416
Author:Ron Larson, Betsy Farber
Publisher:PEARSON
The Basic Practice of Statistics
Statistics
ISBN:9781319042578
Author:David S. Moore, William I. Notz, Michael A. Fligner
Publisher:W. H. Freeman
Introduction to the Practice of Statistics
Statistics
ISBN:9781319013387
Author:David S. Moore, George P. McCabe, Bruce A. Craig
Publisher:W. H. Freeman