
ENGR.ECONOMIC ANALYSIS
14th Edition
ISBN: 9780190931919
Author: NEWNAN
Publisher: Oxford University Press
expand_more
expand_more
format_list_bulleted
Related questions
Concept explainers
Question

Transcribed Image Text:**Transcription for Educational Website**
---
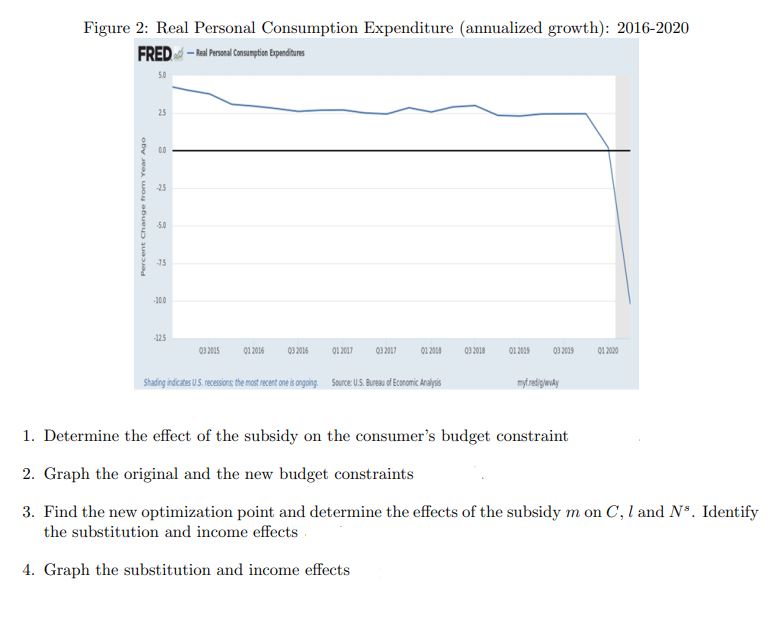
**Figure 2: Real Personal Consumption Expenditure (annualized growth): 2016-2020**
The graph titled "Real Personal Consumption Expenditure" shows the annualized growth rate from 2016 to 2020. The x-axis represents quarters ranging from Q1 2016 to Q3 2020, while the y-axis shows the percent change from the previous year, ranging from -10% to 5%.
- The graph illustrates a nearly stable consumer expenditure growth from 2016 to 2019, fluctuating slightly around the 0% change mark.
- A significant decline is observed in 2020, with the growth rate sharply dropping below -30% by Q2 2020, indicating a substantial decrease in consumer spending.
*Source: U.S. Bureau of Economic Analysis*
---
**Tasks:**
1. **Determine the effect of the subsidy on the consumer’s budget constraint.**
2. **Graph the original and the new budget constraints.**
3. **Find the new optimization point and determine the effects of the subsidy \(m\) on \(C, l\) and \(N^s\). Identify the substitution and income effects.**
4. **Graph the substitution and income effects.**
---
This content is designed to help students analyze data trends and understand the impact of economic subsidies on consumption behavior, using visual tools and conceptual inquiries.

Transcribed Image Text:# Post-election program
Figure 2 exhibits real personal consumption expenditure annualized growth. Consumption growth consistently declined during the 2016-2020 period, in spite of the 'Great Recession' having ended more than 10 years ago and in spite of claims of the current administration that consumers are better off, even prior to the beginning of the pandemic.
Based on this evidence, assume Democrats and Republicans lose the 2020 election to reformist Elizabeth H., who becomes the new president of the U.S. Suppose that, in an attempt to make consumers better off, she decides to partially subsidize agents' consumption, based on the amount of hours they work. That is, the government subsidizes a fraction \( m > 0 \) of the consumer's wage income.
---
*1 The ‘hysteresis’ effect refers to the loss of skills or ‘appeal’ to firms due to long periods without formal employment, thus resulting in increasingly higher probabilities of remaining unemployed.*
Expert Solution
This question has been solved!
Explore an expertly crafted, step-by-step solution for a thorough understanding of key concepts.

This is a popular solution

Trending nowThis is a popular solution!

Step by stepSolved in 4 steps with 3 images

Knowledge Booster


Learn more about
Need a deep-dive on the concept behind this application? Look no further. Learn more about this topic, economics and related others by exploring similar questions and additional content below.Similar questions
- 10. What happens to the demand curve for an inferior good if a consumer's income increases? Show me using a diagram, please.arrow_forwardSuppose the following table shows your demand schedule for CDs. Price Quantity Demanded $15 1 12 9. 9:56 6. 4 (a) What is your total utility from four CDs? Total utility: $ (b) What is your marginal utility from the fourth CD? Marginal utility: $ (c) If the price is $6, how much will your consumer surplus be? Consumer surplus: $arrow_forwards) Using the indifference curves, a budget line and a price change, show how we can derive an individual's demand curve for a product..arrow_forward
- Explain how the market demand curve for a ‘normal’ good will shift (i.e. left, right or noshift) in each of the following cases? What then will happen to the equilibrium price andquantity?(a) The price of a substitute good risesClick or tap here to enter text.(b) The price of a complementary good fallsClick or tap here to enter text.(c) The price of the good increasesClick or tap here to enter text.(d) Tastes shift away from the goodClick or tap here to enter text.(e) Personal income increases with diagrams pleasearrow_forward05- Income and Substitution Effects Question 4arrow_forwardTwo goods are complements when a decrease in the price of one good O decreases the quantity demanded of the other good. O decreases the demand for the other good. O increases the quantity demanded of the other good. increases the demand for the other good.arrow_forward
arrow_back_ios
arrow_forward_ios
Recommended textbooks for you
 Principles of Economics (12th Edition)EconomicsISBN:9780134078779Author:Karl E. Case, Ray C. Fair, Sharon E. OsterPublisher:PEARSON
 Engineering Economy (17th Edition)EconomicsISBN:9780134870069Author:William G. Sullivan, Elin M. Wicks, C. Patrick KoellingPublisher:PEARSON
 Principles of Economics (MindTap Course List)EconomicsISBN:9781305585126Author:N. Gregory MankiwPublisher:Cengage Learning
 Managerial Economics: A Problem Solving ApproachEconomicsISBN:9781337106665Author:Luke M. Froeb, Brian T. McCann, Michael R. Ward, Mike ShorPublisher:Cengage Learning
 Managerial Economics & Business Strategy (Mcgraw-...EconomicsISBN:9781259290619Author:Michael Baye, Jeff PrincePublisher:McGraw-Hill Education
Principles of Economics (12th Edition)
Economics
ISBN:9780134078779
Author:Karl E. Case, Ray C. Fair, Sharon E. Oster
Publisher:PEARSON
Engineering Economy (17th Edition)
Economics
ISBN:9780134870069
Author:William G. Sullivan, Elin M. Wicks, C. Patrick Koelling
Publisher:PEARSON
Principles of Economics (MindTap Course List)
Economics
ISBN:9781305585126
Author:N. Gregory Mankiw
Publisher:Cengage Learning
Managerial Economics: A Problem Solving Approach
Economics
ISBN:9781337106665
Author:Luke M. Froeb, Brian T. McCann, Michael R. Ward, Mike Shor
Publisher:Cengage Learning
Managerial Economics & Business Strategy (Mcgraw-...
Economics
ISBN:9781259290619
Author:Michael Baye, Jeff Prince
Publisher:McGraw-Hill Education