
MATLAB: An Introduction with Applications
6th Edition
ISBN: 9781119256830
Author: Amos Gilat
Publisher: John Wiley & Sons Inc
expand_more
expand_more
format_list_bulleted
Related questions
Concept explainers
Question
answer both parts
please list z score
an the intervals
like
test stastic
fortmula with values
the procedure name
the parameter in c level context
and if its random or normal
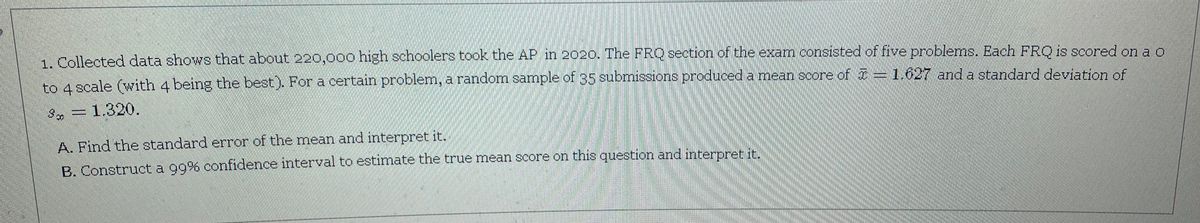

Transcribed Image Text:1. Collected data shows that about 220,000 high schoolers took the AP in 2020. The FRQ section of the exam consisted of five problems. Each FRO is scored on ao
to 4 scale (with 4 being the best). For a certain problem, a random sample of 35 submissions produced a mean score of = 1.627 and a standard deviation of
=1.320.
A. Find the standard error of the mean and interpret it.
B. Construct a g9% confidence interval to estimate the true mean score on this question and interpret it.
Expert Solution
This question has been solved!
Explore an expertly crafted, step-by-step solution for a thorough understanding of key concepts.

Step by stepSolved in 3 steps

Knowledge Booster


Learn more about
Need a deep-dive on the concept behind this application? Look no further. Learn more about this topic, statistics and related others by exploring similar questions and additional content below.Similar questions
- please list z score an the intervals like mean and standard devation. test stastic fortmula with values the procedure name the parameter in c level context and if its random or normaarrow_forwardnot use ai pleasearrow_forward← Listed below are systolic blood pressure measurements (mm Hg) taken from the right and left arms of the same woman. Assume that the paired sample data is a simple random sample and that the differences have a distribution that is approximately normal. Use a 0.05 significance level to test for a difference between the measurements from the two arms. What can be concluded? Right arm Left arm 148 174 In this example, μg is the mean value of the differences d for the population of all pairs of data, where each individual difference d is defined as the measurement from the right arm minus the measurement from the left arm. What are the null and alternative hypotheses for the hypothesis test? O A. Ho Hd = 0 H₁ Hd #0 OC. Ho Hd #0 H₁-Hd = 0 135 121 137 134 170 190 152 134 Identify the test statistic. (Round to two decimal places as needed.) Identify the P-value P-value = (Round to three decimal places as needed.) What is the conclusion based on the hypothesis test? Since the P-value is than…arrow_forward
arrow_back_ios
arrow_forward_ios
Recommended textbooks for you
- MATLAB: An Introduction with ApplicationsStatisticsISBN:9781119256830Author:Amos GilatPublisher:John Wiley & Sons Inc
 Probability and Statistics for Engineering and th...StatisticsISBN:9781305251809Author:Jay L. DevorePublisher:Cengage Learning
 Statistics for The Behavioral Sciences (MindTap C...StatisticsISBN:9781305504912Author:Frederick J Gravetter, Larry B. WallnauPublisher:Cengage Learning
  Elementary Statistics: Picturing the World (7th E...StatisticsISBN:9780134683416Author:Ron Larson, Betsy FarberPublisher:PEARSON
 The Basic Practice of StatisticsStatisticsISBN:9781319042578Author:David S. Moore, William I. Notz, Michael A. FlignerPublisher:W. H. Freeman
 Introduction to the Practice of StatisticsStatisticsISBN:9781319013387Author:David S. Moore, George P. McCabe, Bruce A. CraigPublisher:W. H. Freeman
MATLAB: An Introduction with Applications
Statistics
ISBN:9781119256830
Author:Amos Gilat
Publisher:John Wiley & Sons Inc
Probability and Statistics for Engineering and th...
Statistics
ISBN:9781305251809
Author:Jay L. Devore
Publisher:Cengage Learning
Statistics for The Behavioral Sciences (MindTap C...
Statistics
ISBN:9781305504912
Author:Frederick J Gravetter, Larry B. Wallnau
Publisher:Cengage Learning
Elementary Statistics: Picturing the World (7th E...
Statistics
ISBN:9780134683416
Author:Ron Larson, Betsy Farber
Publisher:PEARSON
The Basic Practice of Statistics
Statistics
ISBN:9781319042578
Author:David S. Moore, William I. Notz, Michael A. Fligner
Publisher:W. H. Freeman
Introduction to the Practice of Statistics
Statistics
ISBN:9781319013387
Author:David S. Moore, George P. McCabe, Bruce A. Craig
Publisher:W. H. Freeman