
MATLAB: An Introduction with Applications
6th Edition
ISBN: 9781119256830
Author: Amos Gilat
Publisher: John Wiley & Sons Inc
expand_more
expand_more
format_list_bulleted
Related questions
Question
thank you ..
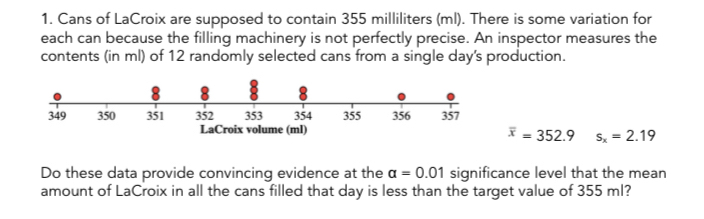

Transcribed Image Text:1. Cans of LaCroix are supposed to contain 355 milliliters (ml). There is some variation for
each can because the filling machinery is not perfectly precise. An inspector measures the
contents (in ml) of 12 randomly selected cans from a single day's production.
349 350 351
352
353 354
LaCroix volume (ml)
355
356 357
* = 352.9 sx = 2.19
Do these data provide convincing evidence at the a = 0.01 significance level that the mean
amount of LaCroix in all the cans filled that day is less than the target value of 355 ml?

Transcribed Image Text:General Formula:
Specific Formula:
Work:
Test statistic:
P-value:
CONCLUDE: Make a conclusion about the hypotheses in the context of the problem.
Conclusion:
Expert Solution
This question has been solved!
Explore an expertly crafted, step-by-step solution for a thorough understanding of key concepts.

This is a popular solution

Trending nowThis is a popular solution!

Step by stepSolved in 2 steps with 2 images

Knowledge Booster

Similar questions
- The r-value shows if there is a difference between the two variables being tested. Group of answer choices True Falsearrow_forward4. For each picture below, draw a line from the picture to its respective equation. 2 1 %3! 3 2 1 2 1 23 2 1 2 1 326 3 !! Note: x represents of and x; represents-of 3 2 Xarrow_forwardNo written by hand solutionarrow_forward
- Find the distance between the points given. (1, 2)and (13, 7) (8, 15)and(-7, 23) (-15,–18)and (3, 6) 1. 2. 3.arrow_forwardQ3. The table below shows the rate of charges for taxi fare. Booking Fee Monday to Friday - 7.00 a.m. to 9.30 a.m. 5.00 p.m. to 11.00 p.m. $4.00 $2.50 All other times (including Saturday, Sunday and all Public Holidays $2.50 Charges for 1st km or less $0.10 Charges for every 200 meters thereafter Mr Lee booked a taxi at 10.00 a.m. His taxi fare came up to $9. What was the maximum distance he could have travelled?arrow_forward
arrow_back_ios
arrow_forward_ios
Recommended textbooks for you
- MATLAB: An Introduction with ApplicationsStatisticsISBN:9781119256830Author:Amos GilatPublisher:John Wiley & Sons Inc
 Probability and Statistics for Engineering and th...StatisticsISBN:9781305251809Author:Jay L. DevorePublisher:Cengage Learning
 Statistics for The Behavioral Sciences (MindTap C...StatisticsISBN:9781305504912Author:Frederick J Gravetter, Larry B. WallnauPublisher:Cengage Learning
  Elementary Statistics: Picturing the World (7th E...StatisticsISBN:9780134683416Author:Ron Larson, Betsy FarberPublisher:PEARSON
 The Basic Practice of StatisticsStatisticsISBN:9781319042578Author:David S. Moore, William I. Notz, Michael A. FlignerPublisher:W. H. Freeman
 Introduction to the Practice of StatisticsStatisticsISBN:9781319013387Author:David S. Moore, George P. McCabe, Bruce A. CraigPublisher:W. H. Freeman
MATLAB: An Introduction with Applications
Statistics
ISBN:9781119256830
Author:Amos Gilat
Publisher:John Wiley & Sons Inc
Probability and Statistics for Engineering and th...
Statistics
ISBN:9781305251809
Author:Jay L. Devore
Publisher:Cengage Learning
Statistics for The Behavioral Sciences (MindTap C...
Statistics
ISBN:9781305504912
Author:Frederick J Gravetter, Larry B. Wallnau
Publisher:Cengage Learning
Elementary Statistics: Picturing the World (7th E...
Statistics
ISBN:9780134683416
Author:Ron Larson, Betsy Farber
Publisher:PEARSON
The Basic Practice of Statistics
Statistics
ISBN:9781319042578
Author:David S. Moore, William I. Notz, Michael A. Fligner
Publisher:W. H. Freeman
Introduction to the Practice of Statistics
Statistics
ISBN:9781319013387
Author:David S. Moore, George P. McCabe, Bruce A. Craig
Publisher:W. H. Freeman