
ENGR.ECONOMIC ANALYSIS
14th Edition
ISBN: 9780190931919
Author: NEWNAN
Publisher: Oxford University Press
expand_more
expand_more
format_list_bulleted
Related questions
Question
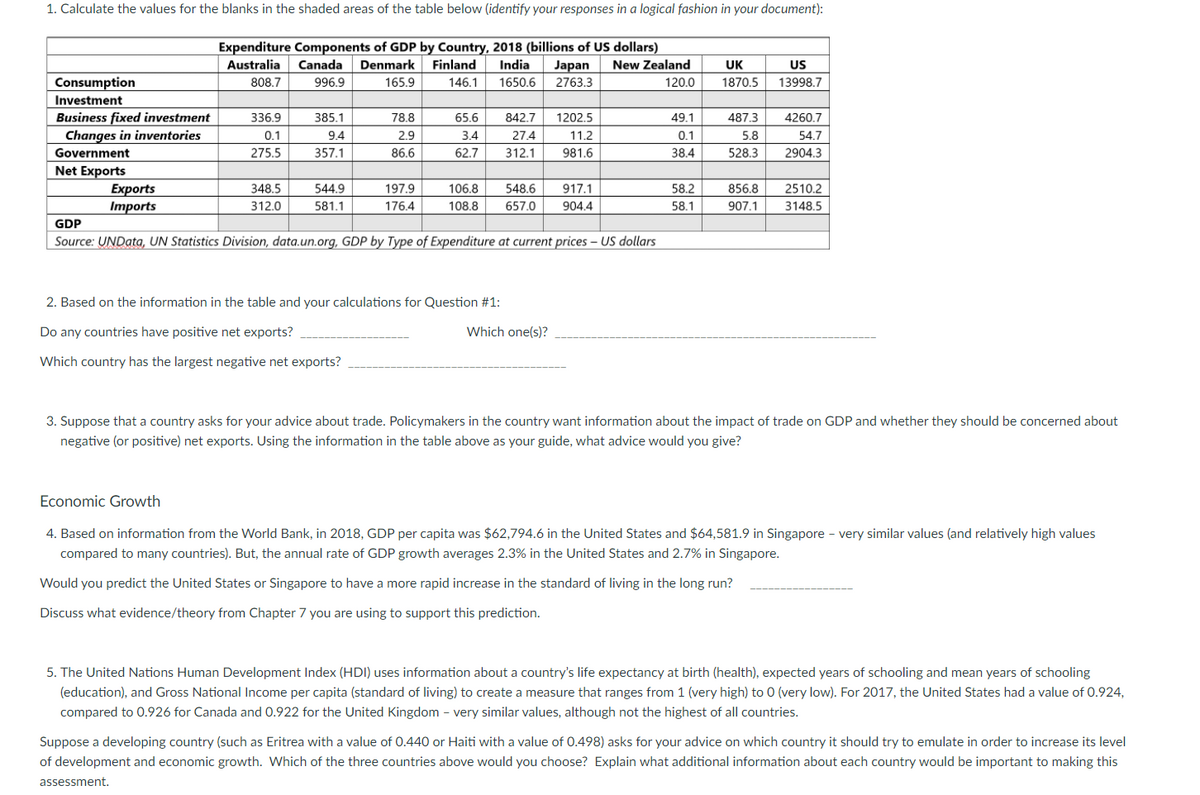

Transcribed Image Text:1. Calculate the values for the blanks in the shaded areas of the table below (identify your responses in a logical fashion in your document):
Expenditure Components of GDP by Country, 2018 (billions of US dollars)
Denmark Finland
Australia
Canada
India
Japan
New Zealand
UK
US
Consumption
808.7
996.9
165.9
146.1
1650.6
2763.3
120.0
1870.5
13998.7
Investment
Business fixed investment
336.9
385.1
78.8
65.6
842.7
1202.5
49.1
487.3
4260.7
Changes in inventories
0.1
9.4
2.9
3.4
27.4
11.2
0.1
5.8
54.7
Government
275.5
357.1
86.6
62.7
312.1
981.6
38.4
528.3
2904.3
Net Exports
Exports
Imports
348.5
544.9
197.9
106.8
548.6
917.1
58.2
856.8
2510.2
312.0
581.1
176.4
108.8
657.0
904.4
58.1
907.1
3148.5
GDP
Source: UNData, UN Statistics Division, data.un.org, GDP by Type of Expenditure at current prices – US dollars
2. Based on the information in the table and your calculations for Question #1:
Do any countries have positive net exports?
Which one(s)?
Which country has the largest negative net exports?
3. Suppose that a country asks for your advice about trade. Policymakers in the country want information about the impact of trade on GDP and whether they should be concerned about
negative (or positive) net exports. Using the information in the table above as your guide, what advice would you give?
Economic Growth
4. Based on information from the World Bank, in 2018, GDP per capita was $62,794.6 in the United States and $64,581.9 in Singapore - very similar values (and relatively high values
compared to many countries). But, the annual rate of GDP growth averages 2.3% in the United States and 2.7% in Singapore.
Would you predict the United States or Singapore to have a more rapid increase in the standard of living in the long run?
Discuss what evidence/theory from Chapter 7 you are using to support this prediction.
5. The United Nations Human Development Index (HDI) uses information about a country's life expectancy at birth (health), expected years of schooling and mean years of schooling
(education), and Gross National Income per capita (standard of living) to create a measure that ranges from 1 (very high) to 0 (very low). For 2017, the United States had a value of 0.924,
compared to 0.926 for Canada and 0.922 for the United Kingdom - very similar values, although not the highest of all countries.
Suppose a developing country (such as Eritrea with a value of 0.440 or Haiti with a value of 0.498) asks for your advice on which country it should try to emulate in order to increase its level
of development and economic growth. Which of the three countries above would you choose? Explain what additional information about each country would be important to making this
assessment.
Expert Solution
This question has been solved!
Explore an expertly crafted, step-by-step solution for a thorough understanding of key concepts.

This is a popular solution

Trending nowThis is a popular solution!

Step by stepSolved in 3 steps

Knowledge Booster

Similar questions
- Question 3arrow_forwardDollars (trillions) 25 20 15- 10- 0 -5 11 Expenditure components of nominal GDP 1950 GDP (Y) Consumption (C) Investment (1) Government spending (G) Exports (X) Imports (M) 1960 Figure Data Notes 1970 198 1990 2000 2010 The following will refer to the data table in the chart above, to access the data table for this graph you will need to click on the data button at the bottom of the chart. In Q2 of 2008 which of the following were above 9 trillion dollars (annualized)? Select the two correct answers.arrow_forwardUsing the following information for a U.S. state: Nominal GDP (millions) 1,151,119 1,879,520 2,350,807 3,701,354 Real GDP (millions 2009 $'s) 1,421,713 1,975,457 2,143,167 2,885,627 Population 32,987,911 36,020,878 38,792,459 39,029,342 Year 1998 2006 2014 2022 Note: time periods of interest are 1998-2006 & 2006-2014 a What is the average annual growth rate for this state during the time periods listed. b. What is the average annual inflation rate for this state during the time periods listed? c. To what extent are living standards likely changing in this economy? Explain and support your claim using data from the table above.arrow_forward
- The following table shows data on personal consumption expenditures, gross private domestic investment, exports, imports, and government consumption expenditures and gross investment for the United States in 2007, as published by the Bureau of Economic Analysis. All figures are in billions of dollars. Fill in the missing cells in the following table to calculate GDP. Components Personal Consumption Expenditures (CC) $9,734.2 Gross Private Domestic Investment (II) $2,125.4 Exports (XX) $1,643 Imports (MM) $2,351 Net exports of goods and services (X−MX−M) Government Consumption Expenditures and Gross Investment (GG) $2,689.8 Gross domestic product (GDP) This method of calculating GDP, which involves summing the , is called the approach.arrow_forwardHow do I/ Where can I find the relative size of each of the components (in absolute dollars and as a percentage of GDP) from the U.S. economy from the Bureau of economic analysis (BEA) website? (https://www.bea.gov/news/2023/gross-domestic-product-second-quarter-2023-second-estimate-and-corporate-profits) The four components that make up GDP are: Concumption, investments, governemnt spending and net exportsarrow_forwardConsider the following national accounts data for Westeros: Westeros' National Accounts (2019) GDP Item (S billions) Corporate income 140 Еxports 50 Wages and salaries 550 Net international income to the rest of the 8 world Gross investment 160 Government purchases 184 Indirect taxes 75 Personal consumption 500 Imports 27 Depreciation 79 Proprietors' incomes and rents Which is the following is the income-based estimate of GDP for Westeros? 65 $909 billion $751 billion $558 billion $939 billionarrow_forward
- Find the last year GDP data and the personal consumption expenditure data (in billions) for the US economy. Section 1: Domestic Product and Incomearrow_forwardPosted part (d) and (e) as another question. Please do that too.arrow_forwardThe following expenditure equation is utilised to measure the economy: GDP = C + I + G + (X-M) Analyse each of the situations below and state which expenditures (or parts of the expenditures) would be counted under which of the four segments of the GDP expenditure equation, ie C, I, G or (X-M). a. The purchase of Australian made furniture by a business for use in its cafe. b. The purchase of foreign made furniture by a business for use in its café. c. The purchase of wood by a business to manufacture furniture which will then be sold to Australian and foreign customers. d. The purchase of 100 shares in ANZ Bank through a stockbroker. e. Purchase of a 10-year-old foreign-made second-hand car from a Car Sales business in Parramatta, NSW. f. A pension paid by the Australian Government to an old age pensioner. g. You babysit for your nieces and nephews so your sister and her husband can go out for dinner.arrow_forward
- Use the following Table to answer Part (a) Assume that Bolivia has the following economic data: GDP (Y) 550 billion Taxes (T) 120 billion National Savings (S) 180 billion Private Savings 154 billion Net Exports ((NX) 49 billion (a) Calculate the following variables for Bolivia: (i) Consumption (C): [2 Points] (ii) Investment (I); [2 Points] (iii) Public Savings: [2 Points] (iv) Government Spending (G). [2 Points] Iarrow_forwardGDP Data (in $ billion) Table 7-1 Durable goods = $10,600.49 Services = $12,500.56 %3D Business purchases of capital goods = $1,080.00 Fixed investment = $1,970.45 Exports = $700.00 Imports = $820.46 Nondurable goods = $1,000.46 Inventory investment = $301.25 Government transfer payments - $1,240.26 %3D Purchases of new residential housing - $890.45 Government purchases = $7.890.56 Refer to Table 7-1. GDP is equal to O S34,141.31 O $33,143.31 O $34,133.31 O $34.143.31arrow_forwardThe following table shows the U.S. gross domestic product (GDP) G, in trillions of dollars, as a function of the year t. t = Year 2004 2010 2014 G = GDP(trillions of dollars) 11.87 14.66 17.42 (a) Explain in practical terms what G(2010) means. The expression G(2010) is the year when the U.S. gross domestic product had a value of 11.87 trillion dollars.The expression G(2010) is the gross domestic product in trillions of dollars, multiplied by 2010. The expression G(2010) is the average of G(2004) and G(2010).The expression G(2010) is the U.S. gross domestic product in trillions of dollars in the year 2010. Find G(2010).$ trillion(b) Use functional notation to express the gross domestic product in 2012, and estimate that value. (Round the estimated value to two decimal places.) G = $ trillion(c) What is the average yearly rate of change in G from 2010 to 2014? (Round your answer to two decimal places.)$ trillion(d) Use your answer from part (c) to…arrow_forward
arrow_back_ios
SEE MORE QUESTIONS
arrow_forward_ios
Recommended textbooks for you
 Principles of Economics (12th Edition)EconomicsISBN:9780134078779Author:Karl E. Case, Ray C. Fair, Sharon E. OsterPublisher:PEARSON
 Engineering Economy (17th Edition)EconomicsISBN:9780134870069Author:William G. Sullivan, Elin M. Wicks, C. Patrick KoellingPublisher:PEARSON
 Principles of Economics (MindTap Course List)EconomicsISBN:9781305585126Author:N. Gregory MankiwPublisher:Cengage Learning
 Managerial Economics: A Problem Solving ApproachEconomicsISBN:9781337106665Author:Luke M. Froeb, Brian T. McCann, Michael R. Ward, Mike ShorPublisher:Cengage Learning
 Managerial Economics & Business Strategy (Mcgraw-...EconomicsISBN:9781259290619Author:Michael Baye, Jeff PrincePublisher:McGraw-Hill Education
Principles of Economics (12th Edition)
Economics
ISBN:9780134078779
Author:Karl E. Case, Ray C. Fair, Sharon E. Oster
Publisher:PEARSON
Engineering Economy (17th Edition)
Economics
ISBN:9780134870069
Author:William G. Sullivan, Elin M. Wicks, C. Patrick Koelling
Publisher:PEARSON
Principles of Economics (MindTap Course List)
Economics
ISBN:9781305585126
Author:N. Gregory Mankiw
Publisher:Cengage Learning
Managerial Economics: A Problem Solving Approach
Economics
ISBN:9781337106665
Author:Luke M. Froeb, Brian T. McCann, Michael R. Ward, Mike Shor
Publisher:Cengage Learning
Managerial Economics & Business Strategy (Mcgraw-...
Economics
ISBN:9781259290619
Author:Michael Baye, Jeff Prince
Publisher:McGraw-Hill Education