
ENGR.ECONOMIC ANALYSIS
14th Edition
ISBN: 9780190931919
Author: NEWNAN
Publisher: Oxford University Press
expand_more
expand_more
format_list_bulleted
Related questions
Question
thumb_up100%
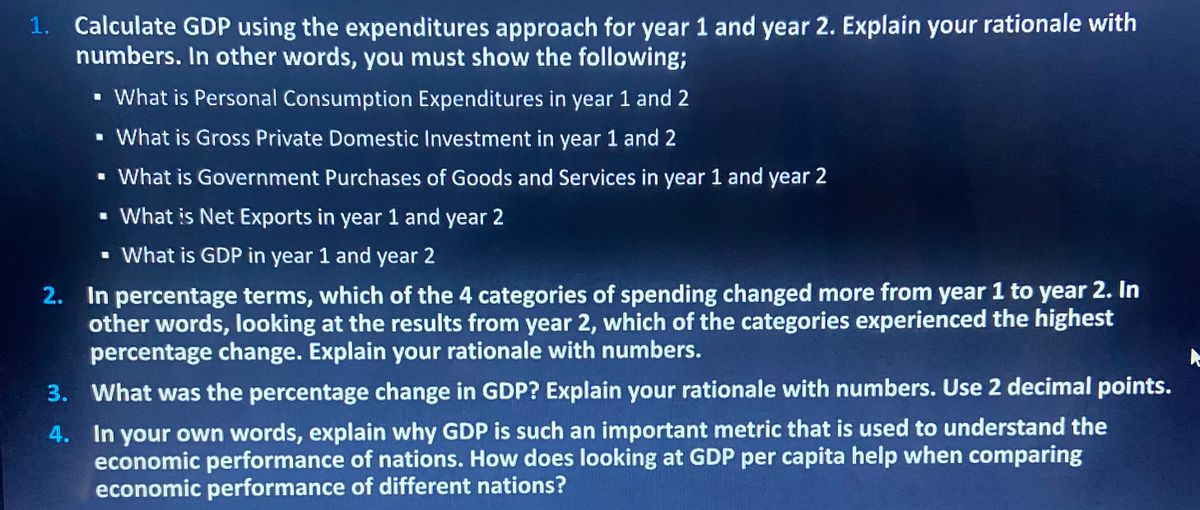

Transcribed Image Text:1. Calculate GDP using the expenditures approach for year 1 and year 2. Explain your rationale with
numbers. In other words, you must show the following;
▪ What is Personal Consumption Expenditures in year 1 and 2
▪ What is Gross Private Domestic Investment in year 1 and 2
▪ What is Government Purchases of Goods and Services in year 1 and year 2
What is Net Exports in year 1 and year 2
▪ What is GDP in year 1 and year 2
2. In percentage terms, which of the 4 categories of spending changed more from year 1 to year 2. In
other words, looking at the results from year 2, which of the categories experienced the highest
percentage change. Explain your rationale with numbers.
3. What was the percentage change in GDP? Explain your rationale with numbers. Use 2 decimal points.
4.
In your own words, explain why GDP is such an important metric that is used to understand the
economic performance of nations. How does looking at GDP per capita help when comparing
economic performance of different nations?

Transcribed Image Text:(Table 1) National Income Accounting 1st year data
Consumption of Durable Goods
Consumption of Nondurable Goods
Compensation of Employees
Consumption of Services
Fixed Residential Investment
Corporate Profits
Fixed Nonresidential Investment
Consumption of Fixed Capital
Change in Inventories
Government Purchases of Goods and Services
Exports
Imports
$1,250,000
$889,000
$865,000
$2,350,000
$645,000
$1,150,000
$730,000
$90,400
$125,000
$940,000
$250,000
45
$360,000
(Table 2) National Income Accounting 2nd year data
Consumption of Durable Goods
Consumption of Nondurable Goods
Compensation of Employees
Consumption of Services
Fixed Residential Investment
Corporate Profits
Fixed Nonresidential Investment
Consumption of Fixed Capital
Change in Inventories
Government Purchases of Goods and Services
Exports
Imports
$1,437,500
$1,022,350
$994,750
$2,702,500
$741,750
$1,322,500
$839,500
$103,960
$143,750
$987,000
$262,500
$378,000
Windows
Expert Solution
This question has been solved!
Explore an expertly crafted, step-by-step solution for a thorough understanding of key concepts.

This is a popular solution

Trending nowThis is a popular solution!

Step by stepSolved in 5 steps with 1 images

Knowledge Booster


Learn more about
Need a deep-dive on the concept behind this application? Look no further. Learn more about this topic, economics and related others by exploring similar questions and additional content below.Similar questions
- Question 3arrow_forwardQuestion 1. Please answer the following questions related to Gross domestic product (GDP). a. There are at least three ways to define or measure Gross Domestic Product (GDP), as discussed in our class. Please briefly describe these three definitions of GDP. b. Assume that total output in an economy consists of 400 apples and 600 oranges and that apples cost $1 each and oranges cost $0.50 each. The labour cost of the production is $50. In this case, what is the value of GDP?arrow_forwardPersonal consumption expenditures $4,750 Exports $810 Federal government spending $1,400 Social Security taxes $600 Depreciation $450 Indirect Business Taxes $550 New Residential Construction $800 Imports $850 Non Residential Investment $300 Corporate Income Taxes $200 Corporate Profits $50 Personal Taxes $800 Business Taxes $1,000 Transfer Payments $700 Part A: In the table above and using the Expenditure Approach calculate the Gross Domestic Product (GDP) in millions of dollars Part B: Now assume that consumers purchase an extra $2000 of goods produced overseas, i.e., the consumption expenditures (from Part A) increase to $6,750. How would this scenario affect the GDP deflator, i.e., increase, decrease, remain unaffected or there is not enough information to tell?arrow_forward
- The following table shows data on personal consumption expenditures, gross private domestic investment, exports, imports, and government consumption expenditures and gross investment for the United States in 2007, as published by the Bureau of Economic Analysis. All figures are in billions of dollars. Fill in the missing cells in the following table to calculate GDP. Components Personal Consumption Expenditures (CC) $9,734.2 Gross Private Domestic Investment (II) $2,125.4 Exports (XX) $1,643 Imports (MM) $2,351 Net exports of goods and services (X−MX−M) Government Consumption Expenditures and Gross Investment (GG) $2,689.8 Gross domestic product (GDP) This method of calculating GDP, which involves summing the , is called the approach.arrow_forwardBelow is a list of domestic output and national income figures for a certain year. All figures are in billions. The questions that follow ask you to determine the major national income measures by both the expenditures and the income approaches. Category Billions Category Personal consumption expenditures $285 Net exports Billions 11 Net foreign factor income 4 Dividends 16 Transfer payments 12 Compensation of employees 263 Rents 14 Taxes on production and imports 18 Statistical discrepancy 8 Undistributed corporate profits 21 Consumption of fixed capital (depreciation) 27 Personal taxes 26 Social Security contributions 20 Corporate income taxes 19 Interest 13 Corporate profits 56 Proprietors' income 43 Government purchases 82 Personal saving 30 Net private domestic investment 33 Instructions: Enter your answers as a whole number. a. Using the above data, determine GDP by both the expenditures approach and the income approach. Then determine NDP. GDP using the expenditures approach = $…arrow_forwardIf in some country personal consumption expenditures in a specific year are $50 billion, purchases of stocks and bonds are $30 billion, net exports are – (negative) $10 billion, government purchases are $30 billion, sales of second-hand items are $8 billion, and gross investment is $35 billion, what is the country’s GDP for the year? Select one: a. $125 billion b. $85 billion c. $95 billion d. $105 billionarrow_forward
- Part A. The income and expenditure approaches to measuring a nation’s GDP can be combined using the circular flow model. Categorize each flow in the following table as part of either aggregate demand or national income. Part B. Fill in the blank with the choices in parentheses While national income and domestic product must be equal, income must also equal expenditure for each of the six sectors in the circular flow diagram: firms, consumers, government, financial system, investors, and the “rest of the world.” For example, the amount of __________(options for blank: disposable income, investment spending, saving, taxes) flowing into the financial system sector must equal the amount of ____________ (saving, consumption plus savings, transfers plus government purchases, investment spending) flowing out of this sector.arrow_forwardExplain some reasons why consumption spending and gross private domestic investment spending are so important. What determinants do they have in common?arrow_forwardGDP Problem. Given the following information, compute GDP by either the Expenditures or the Income approach. [You do not have to compute GDP both ways.] Name which of the two approaches you are using, and identify all the accounts (e.g., “All profits” or “Gross Private Investment”) you use in your computation of GDP. All profits $ 800 Government purchases of goods & services 300 Imports 50 Government transfer payments 250 Exports 50 Gross private investment 500 Rent 20 Wages, salaries 5000 Personal saving 1600 Depreciation 60 Net foreign income 0 Personal consumption expenditures 5200 Taxes on production & tariffs 40 Sales of stocks and bonds 1200 Interest 80 IDENTIFY: ______________________ APPROACH USED ACCOUNT…arrow_forward
- The annual output and prices of a three-good economy are shown in the table below. Quantity of Goods Year 1 Price Year 1 $6 $4 $3 Good Quarts of ice cream Bottles of shampoo Jars of peanut butter Instructions: Enter your answers as a whole number. a. What was the economy's nominal GDP in year 1? $ b. What was its nominal GDP in year 2? 3 1 3 Price Year 2 $6 $4 $3 Quantity of Goods Year 2 5 2 2arrow_forward1.1. What is the US GDP for the first quarter and second quarter of 2020? What is the personal consumption expenditures for the first quarter and second quarter of 2020?arrow_forwardWhy do economists include only final goods and services in measuring GDP for a particular year? Why don't they include the value of used goods, i.e. cars, furniture, etc., bought and sold? Define net exports. Explain how US exports and imports each affect domestic production. How are net exports determined? Explain how net exports might be a negative amount. Note:- Do not provide handwritten solution. Maintain accuracy and quality in your answer. Take care of plagiarism. Answer completely. You will get up vote for sure.arrow_forward
arrow_back_ios
SEE MORE QUESTIONS
arrow_forward_ios
Recommended textbooks for you
 Principles of Economics (12th Edition)EconomicsISBN:9780134078779Author:Karl E. Case, Ray C. Fair, Sharon E. OsterPublisher:PEARSON
 Engineering Economy (17th Edition)EconomicsISBN:9780134870069Author:William G. Sullivan, Elin M. Wicks, C. Patrick KoellingPublisher:PEARSON
 Principles of Economics (MindTap Course List)EconomicsISBN:9781305585126Author:N. Gregory MankiwPublisher:Cengage Learning
 Managerial Economics: A Problem Solving ApproachEconomicsISBN:9781337106665Author:Luke M. Froeb, Brian T. McCann, Michael R. Ward, Mike ShorPublisher:Cengage Learning
 Managerial Economics & Business Strategy (Mcgraw-...EconomicsISBN:9781259290619Author:Michael Baye, Jeff PrincePublisher:McGraw-Hill Education
Principles of Economics (12th Edition)
Economics
ISBN:9780134078779
Author:Karl E. Case, Ray C. Fair, Sharon E. Oster
Publisher:PEARSON
Engineering Economy (17th Edition)
Economics
ISBN:9780134870069
Author:William G. Sullivan, Elin M. Wicks, C. Patrick Koelling
Publisher:PEARSON
Principles of Economics (MindTap Course List)
Economics
ISBN:9781305585126
Author:N. Gregory Mankiw
Publisher:Cengage Learning
Managerial Economics: A Problem Solving Approach
Economics
ISBN:9781337106665
Author:Luke M. Froeb, Brian T. McCann, Michael R. Ward, Mike Shor
Publisher:Cengage Learning
Managerial Economics & Business Strategy (Mcgraw-...
Economics
ISBN:9781259290619
Author:Michael Baye, Jeff Prince
Publisher:McGraw-Hill Education