
Related questions
Concept explainers
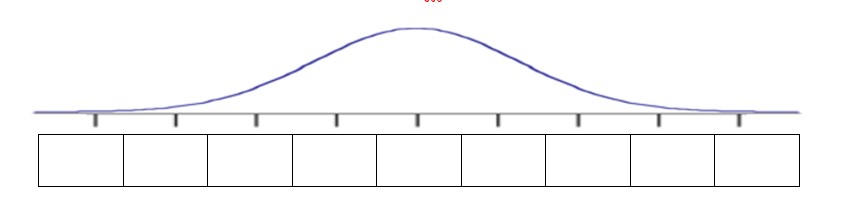
1. Bags of a particular brand of dog food are filled to a mean weight of 5 pounds with a standard deviation of 0.25 pounds. Label the normal curve below to show the complete distribution of fill weights out to four standard deviations in each direction of the mean.
| a. |
What is the z-score of a bag of dog food that weighs 30.15 pounds? Show your calculations. Round to one decimal place. |
|
a2.Write a sentence that explains the meaning of the percentile in the context of bags of dog food. |
|
a3.What is the z-score of a bag of dog food that weighs 30.4 pounds? Show your calculations. Round to one decimal place. |
|
a4. What percentage of dog food bags weigh more than 30.4 pounds? Do not round. (Hint: This answer does not come directly from the z-table. An extra calculation is required!) |


Trending nowThis is a popular solution!

Step by stepSolved in 2 steps with 1 images


- Determine whether the following graph can represent a variable with a nomal distribution. Explain your reasoning. If the graph appears to represent a normal distribution, estimate the mean and standard deviation. 10 15 20 25 30 Could the graph represent a variable with a normal distribution? Explain your reasoning. Select the correct choice below and, if necessary, fill in the answer boxes within your choice. O A. No, because the graph crosses the x-axis. O B. No, because the graph is skewed nght. O C. No, because the graph is skewed left. O D. Yes, the graph fulfills the properties of the normal distribution. The mean is approximately and the standard deviation is about- (Type whole numbers.) Clear all Final chec Help me solve this View an example Get more help -arrow_forwardThe amount of caffeine in a sample of five-ounce servings of brewed coffee is shown in the histogram. Make a frequency distribution for the data. Then use the table to estimate the sample mean and the sample standard deviation of the data set. Click the icon to view the histogram. Complete the table. Round values to the nearest tenth as needed. Graph/chart f Midpoint x xf 70.5 Ay 30- 92.5 26 25- 114.5 136.5 20- 158.5 15- 12 Ef = Exf = 10- Find the mean of the data set. 5- X = (Round to the nearest tenth as needed.) 48.5 70.5 92.5 114.5 136.5 158.5 Complete the table. Round values to the nearest tenth as needed. Midpoint x (x-x)? (x-x)?f X-X 70.5 Print Done 92.5 114.5 136.5 158.5 (x-x)?r= ] ofarrow_forward3. The data in the table shows the mileage that students commute to school. B. Find the weighted mean. Miles Midpoint Frequency 10 - 14 12 8 15 - 19 17 C. Draw a histogram for the data. 20 - 24 22 9 25 - 29 27 21 30 - 34 32 7 A. How many students are in the class?arrow_forward
- Refer to the data set in the accompanying table. Assume that the paired sample data is a simple random sample and the differences have a distribution that is approximately normal. Use a significance level of 0.05 to test for a difference between the weights of discarded paper (in pounds) and weights of discarded plastic (in pounds). E Click the icon to view the data. In this example, Hg is the mean value of the differences d for the population of all pairs of data, where each individual difference d is defined as the weight of discarded paper minus the weight of discarded plastic for a household. What are the null and alternative hypotheses for the hypothesis test? O A. Ho: Ha = 0 H,: Ha #0 O B. Ho: Ha #0 H1: Hd =0 O C. Ho: Ha #0 O D. Ho: Ha = 0 H1: Hd 0arrow_forwardRefer to the data set in the accompanying table. Assume that the paired sample data is a simple random sample and the differences have a distribution that is approximately normal. Use a significance level of 0.10 to test for a difference between the weights of discarded paper (in pounds) and weights of discarded plastic (in pounds). Click the icon to view the data In this example, Hg is the mean value of the differences d for the population of all pairs of data, where each individual difference d is defined as the weight of discarded paper minus the weight of discarded plastic for a household. What are the null and alternative hypotheses for the hypothesis test? O A. H9: Ha =0 H1: Ha 0arrow_forwardKindly answer the three literals in the imagearrow_forward
- MATLAB: An Introduction with ApplicationsStatisticsISBN:9781119256830Author:Amos GilatPublisher:John Wiley & Sons Inc
 Probability and Statistics for Engineering and th...StatisticsISBN:9781305251809Author:Jay L. DevorePublisher:Cengage Learning
 Statistics for The Behavioral Sciences (MindTap C...StatisticsISBN:9781305504912Author:Frederick J Gravetter, Larry B. WallnauPublisher:Cengage Learning
  Elementary Statistics: Picturing the World (7th E...StatisticsISBN:9780134683416Author:Ron Larson, Betsy FarberPublisher:PEARSON
 The Basic Practice of StatisticsStatisticsISBN:9781319042578Author:David S. Moore, William I. Notz, Michael A. FlignerPublisher:W. H. Freeman
 Introduction to the Practice of StatisticsStatisticsISBN:9781319013387Author:David S. Moore, George P. McCabe, Bruce A. CraigPublisher:W. H. Freeman