MATLAB: An Introduction with Applications
6th Edition
ISBN: 9781119256830
Author: Amos Gilat
Publisher: John Wiley & Sons Inc
expand_more
expand_more
format_list_bulleted
Concept explainers
Topic Video
Question
thumb_up100%

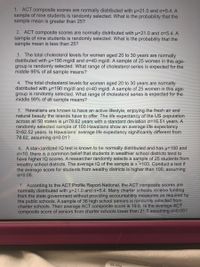
Transcribed Image Text:1. ACT composite scores are normally distributed with u=21.0 and o=5.4. A
sample of nine students is randomly selected. What is the probability that the
sample mean is greater than 25?
2. ACT composite scores are normally distributed with p=21.0 and o=5.4. A
sample of nine students is randomly selected. What is the probability that the
sample mean is less than 25?
3. The total cholesterol levels for women aged 20 to 30 years are normally
distributed with p=190 mg/dl and o=40 mg/dl. A sample of 25 women in this age-
group is randomly selected. What range of cholesterol series is expected for the
middle 95% of all sample means?
4. The total cholesterol levels for women aged 20 to 30 years are normally
distributed with p=190 mg/dl and o=40 mg/dl. A sample of 25 women in this age-
group is randomly selected. What range of cholesterol series is expected for the
middle 99% of all sample means?
5. Hawaiians are known to have an active lifestyle, enjoying the fresh air and
natural beauty the islands have to offer. The life expectancy of the US population
across all 50 states is µ=78.62 years with a standard deviation o=16.51 years. A
randomly selected sample of 100 Hawaiians show an average life expectancy
X=82.52 years. Is Hawaiians' average life expectancy significantly different from
78.62, assuming a=0.01?
6. A standardized IQ test is known to be normally distributed and has µ=100 and
o=10. there is a common belief that students in wealthier school districts tend to
have higher IQ scores. A researcher randomly selects a sample of 25 students from
wealthy school districts. The average IQ of the sample is x =103. Conduct a test if
the average score for students from wealthy districts is higher than 100, assuming
a=0.05.
7. According to the ACT Profile Report-National, the ACT composite scores are
normally distributed with p=21.0 and o=5.4. Many charter schools receive funding
from the state government without providing accountability measures as required by
the public schools. A sample of 36 high school seniors is randomly selected from
charter schools. Their average ACT composite score is 19.8. Is the average ACT
composite score of seniors from charter schools lower than 21.0 assuming a=0.05?
ICA 17716

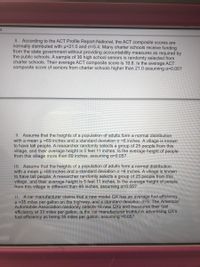
Transcribed Image Text:8. According to the ACT Profile Report-National, the ACT composite scores are
normally distributed with p=21.0 and o=5.4. Many charter schools receive funding
from the state government without providing accountability measures as required by
the public schools. A sample of 36 high school seniors is randomly selected from
charter schools. Their average ACT composite score is 19.8. Is the average ACT
composite score of seniors from charter schools higher than 21.0 assuming a=0.05?
9. Assume that the heights of a population of adults form a normal distribution
with a mean p =69 inches and a standard deviation o =6 inches. A village is known
to have tall people. A researcher randomly selects a group of 25 people from this
village, and their average height is 5 feet 11 inches. Is the average height of people
from this village more than 69 inches, assuming a=0.05?
10. Assume that the heights of a population of adults form a normal distribution
with a meanµ =69 inches and a standard deviation o =6 inches. A village is known
to have tall people. A researcher randomly selects a group of 25 people from this
village, and their average height is 5 feet 11 inches. Is the average height of people
from this village is different than 69 inches, assuming a=0.05?
11. A car manufacturer claims that a new model QX has an average fuel efficiency
p =35 miles per gallon on the highway, and a standard deviation o=5. The American
Automobile Association randomly selects 16 new QXs and measures their fuel
efficiency at 33 miles per gallon. Is the car manufacturer truthful in advertising QX's
fuel efficiency as being 35 miles per gallon, assuming =0.05?
Expert Solution
This question has been solved!
Explore an expertly crafted, step-by-step solution for a thorough understanding of key concepts.
Step by stepSolved in 2 steps

Knowledge Booster
Learn more about
Need a deep-dive on the concept behind this application? Look no further. Learn more about this topic, statistics and related others by exploring similar questions and additional content below.Similar questions
- 1. You throw a fair dice twice. Describe the sample space. What is the probability that the sum of the two numbers you get is 7?arrow_forwardThe class I'm taking is statistics! I am completely stuck. Need help. I have attached the problem. Please view attachment before answering. Thank you!arrow_forward(b) Compute the value of the test statistic. Round the answer to at least three decimal places.arrow_forward
- If the p-value on a coin flip experiment is .002. What would you conclude? Group of answer choices The coin is unfair. The probability of getting the proportion that you did or something more remote is 0.002. The coin is unfair. The probability of the coin being unfair is 0.002. The coin is fair. The probability of the coin being unfair is 0.002. The coin is fair. The probability of getting the proportion that you did or something more remote is 0.998.arrow_forward80. The World Bank records the prevalence of HIV in countries around the world. According to their data, "Prevalence of HIV refers to the percentage of people ages 15 to 49 who are infected with HIV."1 In South Africa, the prevalence of HIV is 17.3%. Let X = the number of people you test until you find a person infected with HIV. a. Sketch a graph of the distribution of the discrete random variable X. b. What is the probability that you must test 30 people to find one with HIV? c. What is the probability that you must ask ten people? d. Find the (i) mean and (ii) standard deviation of the distribution of X.arrow_forward10. A sample of cars was studied. In the sample, 26 white cars were observed, 23 black, 19 grey and 13 silver. What is the probability a car in the study was black?arrow_forward
- Airline passengers arrive randomly and independently at the passenger screening facility at a major international airport. The mean arrival rate is 5 passengers per minute. 1. What is the probability of 2 arrivals in a 1-minute period? 2. What is the probability of no arrivals in a 1-minute period? 3. What is the probability of one arrival in a 1-minute period? 4. What is the probability of at most one arrival in a 1-minute period?arrow_forwardIndicate whether 25 is sufficient or whether a sample of 50 would be necessary. You will want to calculate the probability of the sample mean being between $11,000 and $13,000 for both a sample size of 25 and 50. (Thank You!)arrow_forwardPlease answer all of the questions in the picture and explain each of your answers, Please. Thank you.arrow_forward
arrow_back_ios
arrow_forward_ios
Recommended textbooks for you
 MATLAB: An Introduction with ApplicationsStatisticsISBN:9781119256830Author:Amos GilatPublisher:John Wiley & Sons Inc
 Probability and Statistics for Engineering and th...StatisticsISBN:9781305251809Author:Jay L. DevorePublisher:Cengage Learning
 Statistics for The Behavioral Sciences (MindTap C...StatisticsISBN:9781305504912Author:Frederick J Gravetter, Larry B. WallnauPublisher:Cengage Learning
 Elementary Statistics: Picturing the World (7th E...StatisticsISBN:9780134683416Author:Ron Larson, Betsy FarberPublisher:PEARSON
 The Basic Practice of StatisticsStatisticsISBN:9781319042578Author:David S. Moore, William I. Notz, Michael A. FlignerPublisher:W. H. Freeman
 Introduction to the Practice of StatisticsStatisticsISBN:9781319013387Author:David S. Moore, George P. McCabe, Bruce A. CraigPublisher:W. H. Freeman

MATLAB: An Introduction with Applications
Statistics
ISBN:9781119256830
Author:Amos Gilat
Publisher:John Wiley & Sons Inc

Probability and Statistics for Engineering and th...
Statistics
ISBN:9781305251809
Author:Jay L. Devore
Publisher:Cengage Learning

Statistics for The Behavioral Sciences (MindTap C...
Statistics
ISBN:9781305504912
Author:Frederick J Gravetter, Larry B. Wallnau
Publisher:Cengage Learning

Elementary Statistics: Picturing the World (7th E...
Statistics
ISBN:9780134683416
Author:Ron Larson, Betsy Farber
Publisher:PEARSON

The Basic Practice of Statistics
Statistics
ISBN:9781319042578
Author:David S. Moore, William I. Notz, Michael A. Fligner
Publisher:W. H. Freeman

Introduction to the Practice of Statistics
Statistics
ISBN:9781319013387
Author:David S. Moore, George P. McCabe, Bruce A. Craig
Publisher:W. H. Freeman