
MATLAB: An Introduction with Applications
6th Edition
ISBN: 9781119256830
Author: Amos Gilat
Publisher: John Wiley & Sons Inc
expand_more
expand_more
format_list_bulleted
Related questions
Question
I've completed these questions, I just want to make sure I'm doing them correctly.

Transcribed Image Text:MATH 040- HOMEWORK #1
De to slow
Due Thursday, September 7th by 12:00PM EST on Canvas
laphozoteo L
Name:
Karina Reilly
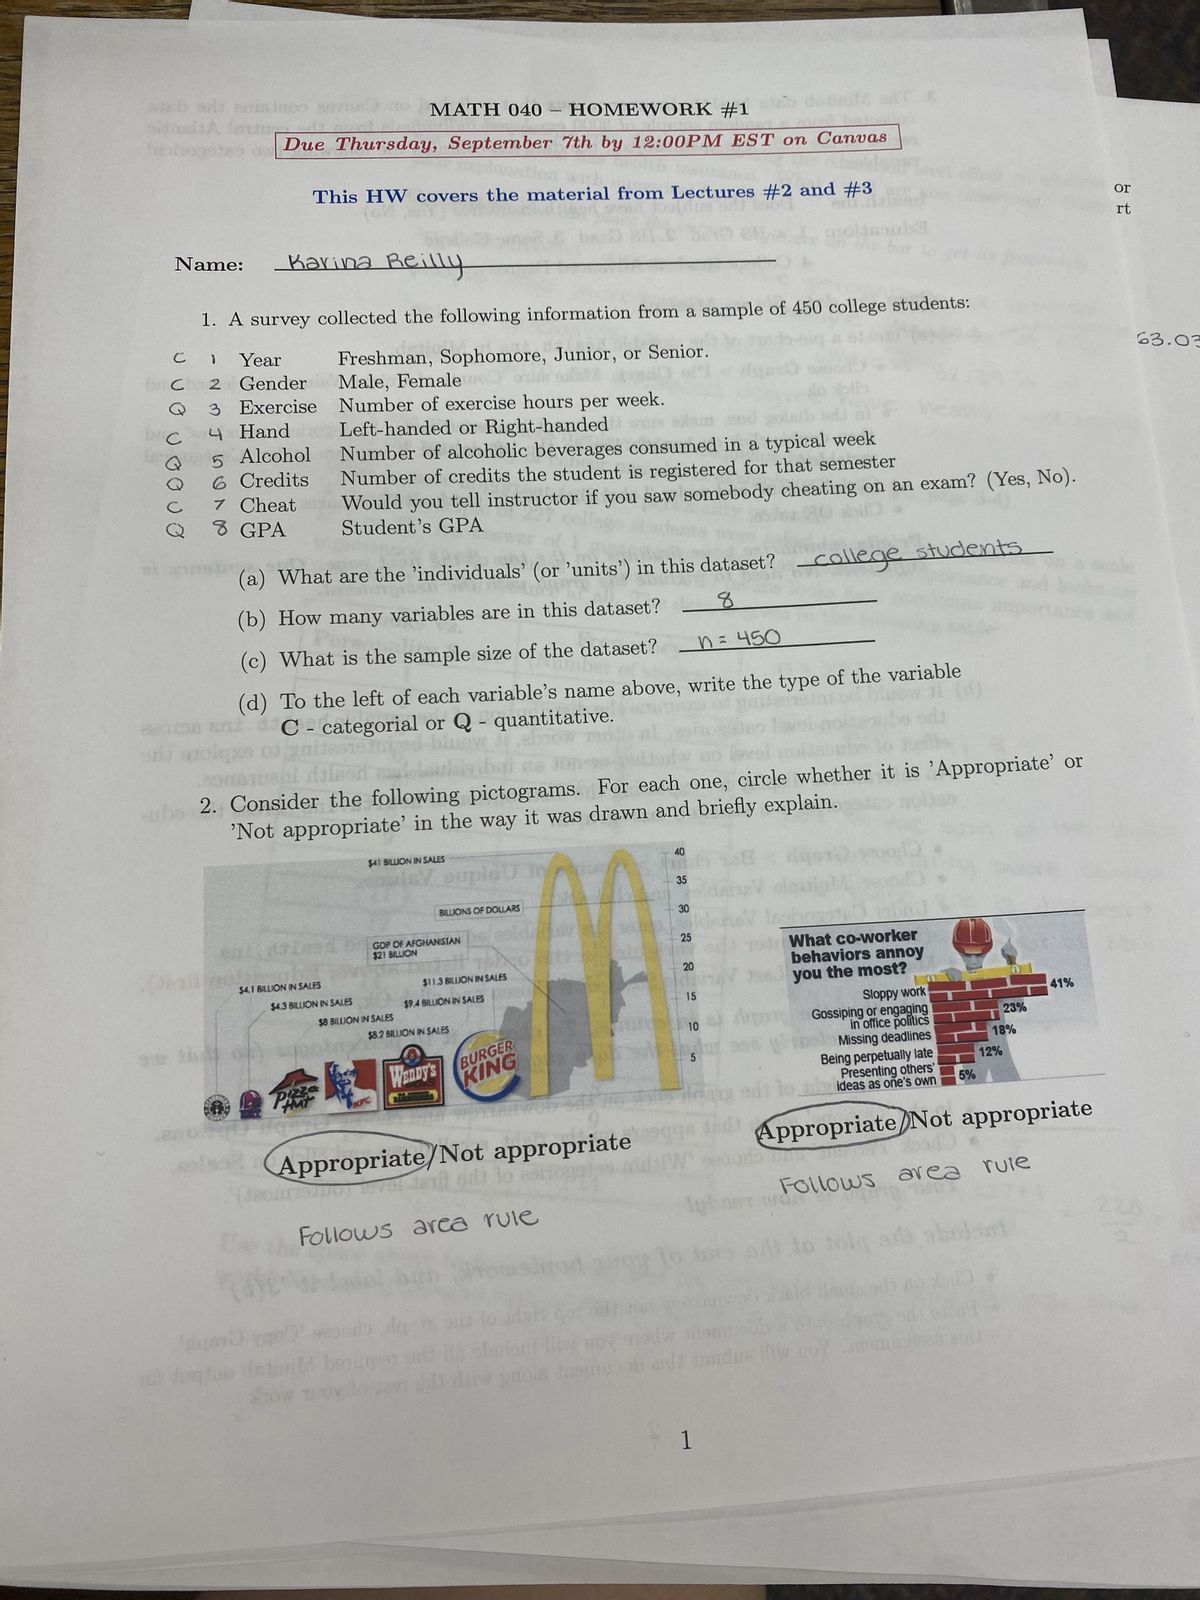
1. A survey collected the following information from a sample of 450 college students:
Freshman, Sophomore, Junior, or Senior.
с
CI
Cho 2
3
Male, Female
e
Number of exercise hours per week.
Left-handed or Right-handed our
en oo
88079
od
10130
Jeni
Year
Gender
Exercise
4 Hand
5 Alcohol
6 Credits
sur ind
7 Cheat
8 GPA
This HW covers the material from Lectures #2 and #3
gvail do
93 8560
(a) What are the 'individuals' (or 'units') in this dataset? college students
(b) How many variables are in this dataset?
8
Jusque
2. Consider the following pictograms. For each one, circle whether it is 'Appropriate' or
'Not appropriate' in the way it was drawn and briefly explain.
(c) What is the sample size of the dataset? = 450
umber
(d) To the left of each variable's name above, write the type of the variable
C - categorial or Q - quantitative.
$4.1 BILLION IN SALES
Number of alcoholic beverages consumed in a typical week
Number of credits the student is registered for that semester
Would you tell instructor if you saw somebody cheating on an exam? (Yes, No).
Student's GPA
鹽味
$4.3 BILLION IN SALES
Hat
dow
$41 BILLION IN SALES
$8 BILLION IN SALES
upial U 10
BILLIONS OF DOLLARS
GDP OF AFGHANISTAN
$21 BILLION
$11.3 BILLION IN SALES
$9.4 BILLION IN SALES
$8.2 BILLION IN SALES
WENDY'S BURGER
KING
Appropriate/Not appropriate
1900 19791
stogoiss
b
Follows area rule
40
35
30
25
20
15
10
5
What co-worker
behaviors annoy
you the most?
1
Sloppy work
Gossiping or engaging
in office politics
Missing deadlines
Being perpetually late
Presenting others'
ideas as one's own
didi timidus illw
5%
olg
23%
18%
12%
Appropriate Not appropriate
doad)
Follows area rule
POS
41%
or
rt
63.03

Transcribed Image Text:oclete
eni
rett
3. The Minitab data health-insurance.mwx that is linked on Canvas contains the data
collected from a random sample of 3000 employed individuals from the central Atlantic
region of the U.S.. For each subject, the data file contains the following two categorical
variables:
health.ins
Education:
Briefly Summarize your findings regarding the education level
not an individual has health insuran
1 are you
XXTL-1
Vir
Does the subject have health insurance (Yes, No)
1.< HS Grad 2. HS Grad 3. Some College
4. College Grad 5. Advanced Degree
Open the data file in Minitab. dor
(a) create a pie-chart of the variable health. ins in Minitab:
POMPE
• Choose Graph > Pie Chart. Make sure 'Counts of Unique Values' is selected and
click ok.
• In the dialog box, make sure the cursor is planted under 'Categorical variables’ and
then double-click on health. ins on the left so that it appears under 'Categorical
variables'.
• Click 'Options' and under 'Label Slices With" check all three boxes.
. Click OK twice.
Briefly summarize your findings on the top of the next page. One sentence is
sufficient. No need to include the graph with the assignment.
Joar
dis
(b) It would be interesting to examine the distribution of the variable health.ins across
the education level categories. In other words, it would be interesting to explore the
effect of education level on whether or not an individual has health insurance.
An informative display for exploring the distribution of health. ins across the edu-
cation categories is a stacked bar-graph.
. Choose Graph > Bar chart > Counts of Unique Values.
Choose 'Multiple Variables' and click Ok.
. Under Categorical Variables, enter the variables education and health. ins
(You MUST enter the variables in the order listed above; Education first).
. Make sure that 'Last Variable Stacked' is chosen and click Ok.
Note that the graph is in counts. To change it to percentages (so that we
can more clearly see what the data suggest):
. At the top right of the graph click on the downarrow and choose Graph Options.
● In the 'Options' menu that appears on the right, scroll down and click on Scales.
Check 'Percent' and choose 'Within categories of the first level (outermost)'.
Your graph is now ready!
Include the plot at the end of your homework, and label it '3(b)'
. Click on the small black downarrow not the top right of the graph, choose 'Copy Graph'.
• Paste the graph onto a document where you will include all the required Minitab output for
this assignment. You will submit this document along with the rest of your work
2
e bar to g
ntage
46.2
eas g
ve h
e #3,
swer t
im im
e ma
llowi
50
JI
4
H
e
YO
Expert Solution
arrow_forward
Step 1: Given information
The provided information is as follows:
The data is given in the example.
The total number of observations is 420.

Trending nowThis is a popular solution!

Step by stepSolved in 6 steps

Knowledge Booster

Similar questions
arrow_back_ios
arrow_forward_ios
Recommended textbooks for you
- MATLAB: An Introduction with ApplicationsStatisticsISBN:9781119256830Author:Amos GilatPublisher:John Wiley & Sons Inc
 Probability and Statistics for Engineering and th...StatisticsISBN:9781305251809Author:Jay L. DevorePublisher:Cengage Learning
 Statistics for The Behavioral Sciences (MindTap C...StatisticsISBN:9781305504912Author:Frederick J Gravetter, Larry B. WallnauPublisher:Cengage Learning
  Elementary Statistics: Picturing the World (7th E...StatisticsISBN:9780134683416Author:Ron Larson, Betsy FarberPublisher:PEARSON
 The Basic Practice of StatisticsStatisticsISBN:9781319042578Author:David S. Moore, William I. Notz, Michael A. FlignerPublisher:W. H. Freeman
 Introduction to the Practice of StatisticsStatisticsISBN:9781319013387Author:David S. Moore, George P. McCabe, Bruce A. CraigPublisher:W. H. Freeman
MATLAB: An Introduction with Applications
Statistics
ISBN:9781119256830
Author:Amos Gilat
Publisher:John Wiley & Sons Inc
Probability and Statistics for Engineering and th...
Statistics
ISBN:9781305251809
Author:Jay L. Devore
Publisher:Cengage Learning
Statistics for The Behavioral Sciences (MindTap C...
Statistics
ISBN:9781305504912
Author:Frederick J Gravetter, Larry B. Wallnau
Publisher:Cengage Learning
Elementary Statistics: Picturing the World (7th E...
Statistics
ISBN:9780134683416
Author:Ron Larson, Betsy Farber
Publisher:PEARSON
The Basic Practice of Statistics
Statistics
ISBN:9781319042578
Author:David S. Moore, William I. Notz, Michael A. Fligner
Publisher:W. H. Freeman
Introduction to the Practice of Statistics
Statistics
ISBN:9781319013387
Author:David S. Moore, George P. McCabe, Bruce A. Craig
Publisher:W. H. Freeman