
MATLAB: An Introduction with Applications
6th Edition
ISBN: 9781119256830
Author: Amos Gilat
Publisher: John Wiley & Sons Inc
expand_more
expand_more
format_list_bulleted
Related questions
Question
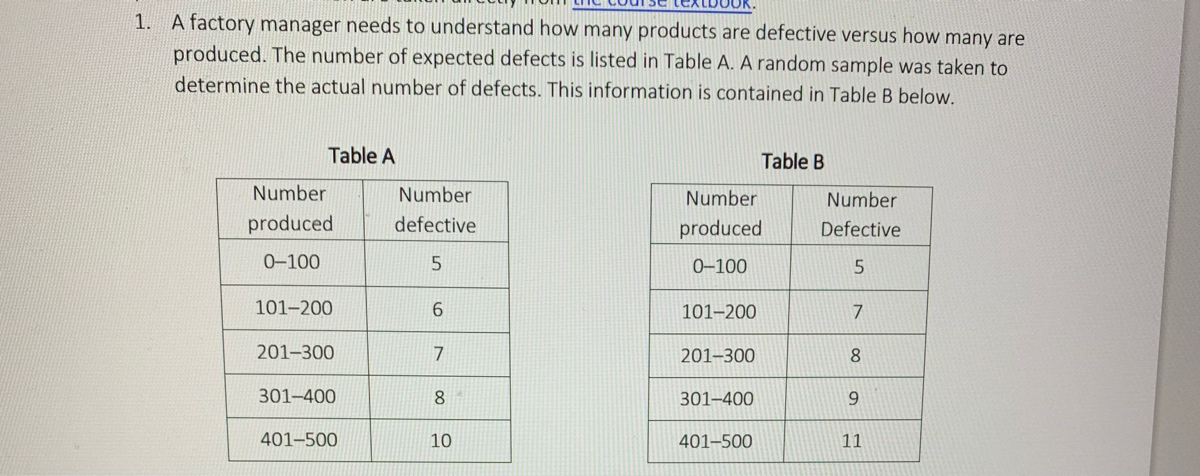

Transcribed Image Text:1. A factory manager needs to understand how many products are defective versus how many are
produced. The number of expected defects is listed in Table A. A random sample was taken to
determine the actual number of defects. This information is contained in Table B below.
Table A
Number
produced
0-100
101-200
201-300
301-400
401-500
Number
defective
5
6
7
8
10
Number
produced
0-100
101-200
201-300
301-400
Table B
401-500
Number
Defective
5
7
8
9
11

Transcribed Image Text:(b) Can a goodness-of-fit test be used? If your answer is, "yes," conduct the goodness-of-fit test.
If you answer is, "no," explain why this test does not apply.
Expert Solution
This question has been solved!
Explore an expertly crafted, step-by-step solution for a thorough understanding of key concepts.

Step by stepSolved in 3 steps with 1 images

Knowledge Booster

Similar questions
- 8. Agri-Beef, Inc. is a large Midwestern farming operation. The company has been a leader in employing statistical techniques in its business. Recently, John Goldberg, operations manager, requested that a random sample of cattle be selected and that these cattle be fed a special diet. The cattle were weighed before the start of the new feeding program and at the end of the feeding program. John wished to estimate the average daily weight gain for cattle on the new feed program. Two hundred Forty cattle were tested, with the following sample results: X = 1.3 pounds gain per day and S= 0.60 pounds gain per day. a. Obtain a 92% confidence interval estimate for the true average daily weight gain. b. Provide a 98% confidence interval estimate for the true average daily weight gain. c. Discuss the difference between the two estimates found in parts a. and b., and indicate the advantages and disadvantages of each. d. John is considering adopting this new diet. However, the weight gain…arrow_forwardWhat is the complete solution and answer to the given problem involving ANOVA?arrow_forward1. Tim Hortons wanted to estimate the difference in the mean amounts of caffeine in two brands of coffee. They took a sample of 18-lbs jars of Brand I and another sample of 13-lbs jars of Brand II coffee. The following summary data (sample statistics) are collected? nį = 10 x, = 23 S1 = 3 Brand I Brand II n2 = 12 x2 = 25 S2 = 4 Assume that the two populations are normally distributed. A. Test at 5 % level of significance, whether there is a difference in the mean amounts of caffeine between the 2 brands of coffee. B. Construct a 95% Confidence Interval to estimate the difference in the mean amounts of caffeine in 2 brands of coffee. C. Does the result in part b) confirm your findings from part a)?arrow_forward
- A sociologist studying New York City ethnic groups wants to determine if there is a difference in income for immigrants from four different countries during their first year in the city. She obtained the data in the following table from a random sample of immigrants from these countries (incomes in thousands of dollars). Use a 0.05 level of significance to test the claim that there is no difference in the earnings of immigrants from the four different countries. Country I Country II Country III Country IV 12.3 8.3 20.4 17.3 9.1 17.2 16.5 8.7 10.9 19.2 22.8 14.2 8.8 10.2 5.5 21.4 16.1 19.2 19.3 (b) Find SSTOT, SSBET, and SSW and check that SSTOT = SSBET + SSW. (Round your answers to three decimal places.) SSTOT = SSBET = SSW = Find d.f.BET, d.f.W, MSBET, and MSW. (Round your answer to three decimal places for MSBET and MSW.) dfBET = dfW = MSBET = MSW = Find the value of the sample F statistic. (Round your answer to three decimal…arrow_forwardA sociologist studying New York City ethnic groups wants to determine if there is a difference in income for immigrants from four different countries during their first year in the city. She obtained the data in the following table from a random sample of immigrants from these countries (incomes in thousands of dollars). Use a 0.05 level of significance to test the claim that there is no difference in the earnings of immigrants from the four different countries. Country I Country II Country III Country IV 12.9 8.8 20.6 17.7 9.8 17.9 16.8 8.7 10.7 19.8 22.6 14.1 8.5 10.3 5.8 21.7 16.9 19.3 19.5 (b) Find SSTOT, SSBET, and SSW and check that SSTOT = SSBET + SSW. (Round your answers to three decimal places.) SSTOT = SSBET = SSW = Find d.f.BET, d.f.W, MSBET, and MSW. (Round your answer to three decimal places for MSBET and MSW.) dfBET = dfW = MSBET = MSW = Find the value of the sample F statistic. (Round your answer to three decimal…arrow_forward2. Jim Miller works in the personnel department for a car company. He is told by his supervisor to investigate the difference in the average number of sick days between blue collar workers and whitecollar workers. So he obtained a random sample of 9 blue collar workers and a random sample of 9 white collar workers. He records the results below.At 10% level of significance, is there sufficient evidence to indicate a difference in mean sick days between blue collar workers and white collar workers.arrow_forward
- You decide that you want to make sure your estimate from part a is correct. You go out and gather 10 simple random samples of 25 people in your school and calculate the proportion of students within each sample whose Amazon packages arrive within two business days of ordering. The proportion of customers that receive their packages within two days of ordering are given below. 0.70, 0.75, 0.6, 0.95, 0.90, 0.73, 0.87, 0.86, 0.92, 0.97 Explain why all of the sample proportions are not the same.arrow_forwardThe age of first marriage for women who responded to a survey by the CDC between 2006 and 2010 is used here. The women who first married in their twenties were randomly divided into three groups: A, B, and C. The ANOVA output is supplied below: Count NAS (Missings) 3773 group Count A 1288 B 1246 C 1239 Frequency Source DF 2 group Residual 3770 28 26 24 Response Variable (age) Summary Mean 22 20 T 0 Group Variable Summary NAS Mean (Missings) 23.73787 A 0 23.76941 0 23.77929 0 23.66344 ANOVA Table: age-group Sum of Squares 10.283 26969 Mean Square Std. Dev. Std. Dev. 2.674442 B F Value Pr>F MSG 0.71875 0.48743 MSE Age of First Marriage in 20's 2.728097 2.664101 2.628699 Carrow_forwardThe data is as follows: 2 0's, 6 1's, 10 2's, 32 3's, 50 4's, 69 5's, 50 6's, 38 7's, 19 8's, 12 9's, and 4 10's.arrow_forward
- The table below shows the auto insurance quotes for two leading companies for a sample of 15 families. Assume the populations SDs are similar, but unknown. The President of the American Insurance Institute wants to compare the yearly costs of such insurance offered by the two companies. At the 0.10 level of significance, can we conclude that there is a difference in the amounts quoted? Families Southern Car American Mutual ($) ($) 1 2090 1610 2 1683 1247 3 1402 2327 4 1830 1367 5 930 1461 6 697 1789 7 1741 1621 8 1129 1914 9 1018 1956 10 1881 1772 11 1571 1375 12 874 1527 13 1579 1767 14 1577 1636 15 860 1188arrow_forwardA governmental agency computed the proportion of violent crimes in the United States in a particular year falling into each of four categories. A simple random sample of 500 violent crimes committed in California during that year were categorized in the same way. The following table presents the results. Category U.S.Proportion CaliforniaFrequency Murder 0.018 4 Forcible Rape 0.07 35 Robbery 0.390 218 Aggravated Assault 0.522 243 Can you conclude that the proportions of crimes in the various categories in California differ from those in the United States as a whole? Use the 0.05 level of significance and the P-value method with the TI-84 Plus calculator. (b) Find the P-value. Round the answer to at least four decimal places.arrow_forward4.A college student is interested in whether there is a difference between male and female students in the amount of time they spend studying each week period the student gathers information from a random sample of male and female students on campus. The amount of time spent studying is normally distributed. The data are: Male Female 27 25 25 29 19 18 10 23 16 20 22 15 14 19 What statistical test should be done to analyze these data? Identify Ho and Ha for this study. Conduct the appropriate analysis. Should Ho be rejected? What should the researcher conclude? If significant, compute and interpret the effect size.arrow_forward
arrow_back_ios
SEE MORE QUESTIONS
arrow_forward_ios
Recommended textbooks for you
- MATLAB: An Introduction with ApplicationsStatisticsISBN:9781119256830Author:Amos GilatPublisher:John Wiley & Sons Inc
 Probability and Statistics for Engineering and th...StatisticsISBN:9781305251809Author:Jay L. DevorePublisher:Cengage Learning
 Statistics for The Behavioral Sciences (MindTap C...StatisticsISBN:9781305504912Author:Frederick J Gravetter, Larry B. WallnauPublisher:Cengage Learning
  Elementary Statistics: Picturing the World (7th E...StatisticsISBN:9780134683416Author:Ron Larson, Betsy FarberPublisher:PEARSON
 The Basic Practice of StatisticsStatisticsISBN:9781319042578Author:David S. Moore, William I. Notz, Michael A. FlignerPublisher:W. H. Freeman
 Introduction to the Practice of StatisticsStatisticsISBN:9781319013387Author:David S. Moore, George P. McCabe, Bruce A. CraigPublisher:W. H. Freeman
MATLAB: An Introduction with Applications
Statistics
ISBN:9781119256830
Author:Amos Gilat
Publisher:John Wiley & Sons Inc
Probability and Statistics for Engineering and th...
Statistics
ISBN:9781305251809
Author:Jay L. Devore
Publisher:Cengage Learning
Statistics for The Behavioral Sciences (MindTap C...
Statistics
ISBN:9781305504912
Author:Frederick J Gravetter, Larry B. Wallnau
Publisher:Cengage Learning
Elementary Statistics: Picturing the World (7th E...
Statistics
ISBN:9780134683416
Author:Ron Larson, Betsy Farber
Publisher:PEARSON
The Basic Practice of Statistics
Statistics
ISBN:9781319042578
Author:David S. Moore, William I. Notz, Michael A. Fligner
Publisher:W. H. Freeman
Introduction to the Practice of Statistics
Statistics
ISBN:9781319013387
Author:David S. Moore, George P. McCabe, Bruce A. Craig
Publisher:W. H. Freeman