MATLAB: An Introduction with Applications
6th Edition
ISBN: 9781119256830
Author: Amos Gilat
Publisher: John Wiley & Sons Inc
expand_more
expand_more
format_list_bulleted
Question

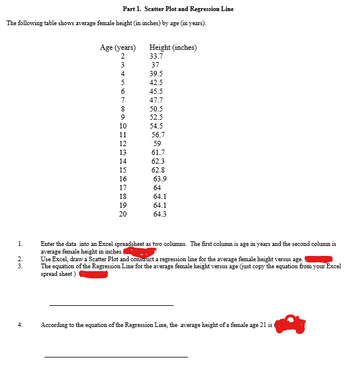
Transcribed Image Text:The following table shows average female height (in inches) by age (in years).
1.
2.
3.
Part 1. Scatter Plot and Regression Line
4.
Age (years)
2
3
4567∞00
8
9
10
11
12
13
14
15
16
17
18
19
20
Height (inches)
33.7
37
39.5
42.5
45.5
47.7
50.5
52.5
54.5
56.7
59
61.7
62.3
62.8
63.9
64
64.1
64.1
64.3
Enter the data into an Excel spreadsheet as two columns. The first column is age in years and the second column is
average female height in inches.
Use Excel, draw a Scatter Plot and construct a regression line for the average female height versus age.
The equation of the Regression Line for the average female height versus age (just copy the equation from your Excel
spread sheet)
According to the equation of the Regression Line, the average height of a female age 21 is

Transcribed Image Text:2.
3.
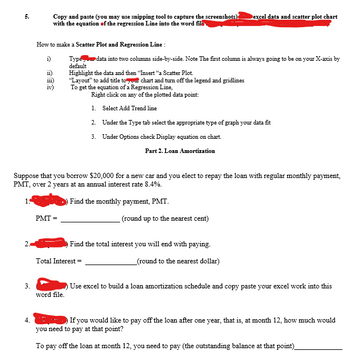
Copy and paste (you may use snipping tool to capture the screenshots).
with the equation of the regression Line into the word file
4.
How to make a Scatter Plot and Regression Line :
i)
Type
default
ii)
iii)
PMT=
Suppose that you borrow $20,000 for a new car and you elect to repay the loan with regular monthly payment,
PMT, over 2 years at an annual interest rate 8.4%.
Find the monthly payment, PMT.
Highlight the data and then "Insert "a Scatter Plot.
"Layout" to add title to our chart and turn off the legend and gridlines
To get the equation of a Regression Line,
Right click on any of the plotted data point:
1. Select Add Trend line
word file.
data into two columns side-by-side. Note The first column is always going to be on your X-axis by
Total Interest=
2.
3.
Dexcel data and scatter plot chart
Under the Type tab select the appropriate type of graph your data fit
Under Options check Display equation on chart.
Part 2. Loan Amortization
(round up to the nearest cent)
Find the total interest you will end with paying.
_(round to the nearest dollar)
Use excel to build a loan amortization schedule and copy paste your excel work into this
If you would like to pay off the loan after one year, that is, at month 12, how much would
you need to pay at that point?
To pay off the loan at month 12, you need to pay (the outstanding balance at that point)_
Expert Solution
This question has been solved!
Explore an expertly crafted, step-by-step solution for a thorough understanding of key concepts.
This is a popular solution
Trending nowThis is a popular solution!
Step by stepSolved in 3 steps with 1 images

Knowledge Booster
Recommended textbooks for you
 MATLAB: An Introduction with ApplicationsStatisticsISBN:9781119256830Author:Amos GilatPublisher:John Wiley & Sons Inc
 Probability and Statistics for Engineering and th...StatisticsISBN:9781305251809Author:Jay L. DevorePublisher:Cengage Learning
 Statistics for The Behavioral Sciences (MindTap C...StatisticsISBN:9781305504912Author:Frederick J Gravetter, Larry B. WallnauPublisher:Cengage Learning
 Elementary Statistics: Picturing the World (7th E...StatisticsISBN:9780134683416Author:Ron Larson, Betsy FarberPublisher:PEARSON
 The Basic Practice of StatisticsStatisticsISBN:9781319042578Author:David S. Moore, William I. Notz, Michael A. FlignerPublisher:W. H. Freeman
 Introduction to the Practice of StatisticsStatisticsISBN:9781319013387Author:David S. Moore, George P. McCabe, Bruce A. CraigPublisher:W. H. Freeman

MATLAB: An Introduction with Applications
Statistics
ISBN:9781119256830
Author:Amos Gilat
Publisher:John Wiley & Sons Inc

Probability and Statistics for Engineering and th...
Statistics
ISBN:9781305251809
Author:Jay L. Devore
Publisher:Cengage Learning

Statistics for The Behavioral Sciences (MindTap C...
Statistics
ISBN:9781305504912
Author:Frederick J Gravetter, Larry B. Wallnau
Publisher:Cengage Learning

Elementary Statistics: Picturing the World (7th E...
Statistics
ISBN:9780134683416
Author:Ron Larson, Betsy Farber
Publisher:PEARSON

The Basic Practice of Statistics
Statistics
ISBN:9781319042578
Author:David S. Moore, William I. Notz, Michael A. Fligner
Publisher:W. H. Freeman

Introduction to the Practice of Statistics
Statistics
ISBN:9781319013387
Author:David S. Moore, George P. McCabe, Bruce A. Craig
Publisher:W. H. Freeman