
MATLAB: An Introduction with Applications
6th Edition
ISBN: 9781119256830
Author: Amos Gilat
Publisher: John Wiley & Sons Inc
expand_more
expand_more
format_list_bulleted
Related questions
Concept explainers
Question
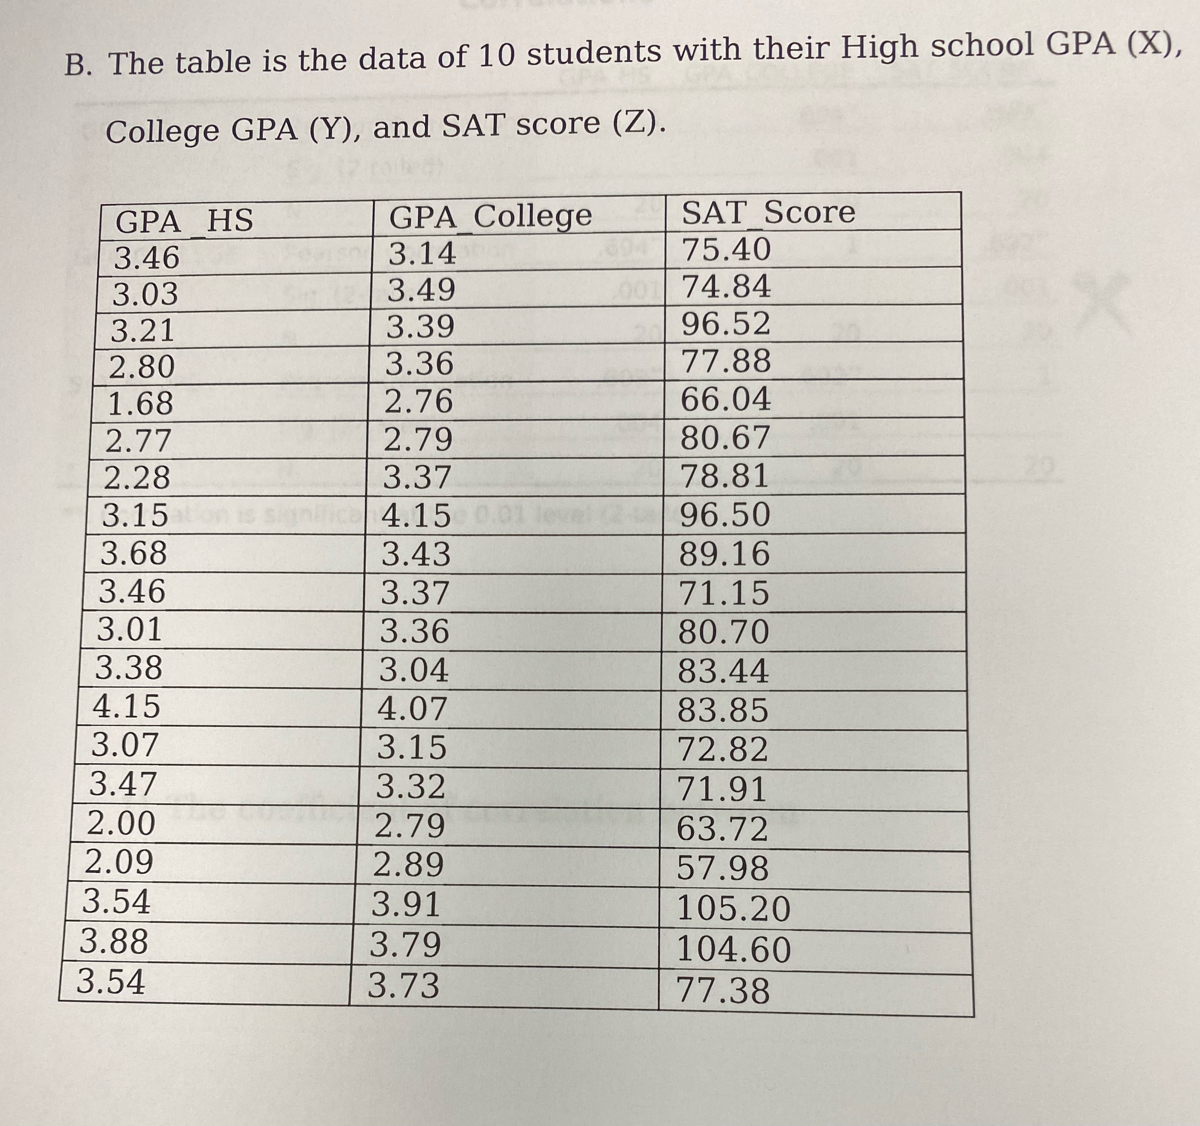

Transcribed Image Text:B. The table is the data of 10 students with their High school GPA (X),
College GPA (Y), and SAT score (Z).
SAT Score
GPA HS
3.46
GPA College
3.14
75.40
0074.84
96.52
3.49
3.03
3.21
2.80
1.68
3.39
3.36
77.88
2.76
66.04
80.67
2.77
2.28
2.79
3.37
78.81
3.15
4.15
96.50
3.68
3.46
3.43
3.37
3.36
89.16
71.15
80.70
3.01
3.38
3.04
83.44
4.15
4.07
83.85
3.07
3.15
3.32
2.79
2.89
72.82
3.47
71.91
2.00
2.09
3.54
3.88
63.72
57.98
105.20
3.91
3.79
104.60
3.54
3.73
77.38

Transcribed Image Text:1) The coefficient of correlation between
2) GPA_HS and GPA College. Attach the SPSS output.
3) Interpret your result on 1) using the coefficient of determination
4) Using SPSS, graph the scatterplot between the GPA HS (x) and GPA_
College(y). Paste the SPSS graph in the space below.
Expert Solution
This question has been solved!
Explore an expertly crafted, step-by-step solution for a thorough understanding of key concepts.

Step by stepSolved in 2 steps

Knowledge Booster


Learn more about
Need a deep-dive on the concept behind this application? Look no further. Learn more about this topic, statistics and related others by exploring similar questions and additional content below.Similar questions
- In correlational research the Null hypothesis states that Choose one the correlation coefficient is 0 or The correlation is significantly different between groups or the correlation coefficient is 1.00 or -1.00arrow_forwardThe top portion of the Pearson's r correlation coefficient equation calculates the______ whereas the bottom portion calculates the___ 1)variance of x and the variance of y; covariance between variables x and y 2)covariance of variable ×; covariance of variable y 3)covariance between variables x and y; variance of x and the variance of y 4)covariance of variable v: covariance of variable x.arrow_forwardIf the correlation coefficient r is equal to 0.585, find the coefficient if determination and the coefficient of no determinationarrow_forward
- Suppose Y1, Y2 and 3Y are not correlated variables, however, have the same standard deviation. Show that correlation between Y1 + Y2 and Y2 + Y3 is equal to half. Whether correlation coefficient is zero or notarrow_forwardPearson's r is the technical term for the correlation coefficient most often used in psychological research. O True O Falsearrow_forwardWhat does it mean if the linear correlation coefficient is A) 0? B) -1?arrow_forward
arrow_back_ios
arrow_forward_ios
Recommended textbooks for you
- MATLAB: An Introduction with ApplicationsStatisticsISBN:9781119256830Author:Amos GilatPublisher:John Wiley & Sons Inc
 Probability and Statistics for Engineering and th...StatisticsISBN:9781305251809Author:Jay L. DevorePublisher:Cengage Learning
 Statistics for The Behavioral Sciences (MindTap C...StatisticsISBN:9781305504912Author:Frederick J Gravetter, Larry B. WallnauPublisher:Cengage Learning
  Elementary Statistics: Picturing the World (7th E...StatisticsISBN:9780134683416Author:Ron Larson, Betsy FarberPublisher:PEARSON
 The Basic Practice of StatisticsStatisticsISBN:9781319042578Author:David S. Moore, William I. Notz, Michael A. FlignerPublisher:W. H. Freeman
 Introduction to the Practice of StatisticsStatisticsISBN:9781319013387Author:David S. Moore, George P. McCabe, Bruce A. CraigPublisher:W. H. Freeman
MATLAB: An Introduction with Applications
Statistics
ISBN:9781119256830
Author:Amos Gilat
Publisher:John Wiley & Sons Inc
Probability and Statistics for Engineering and th...
Statistics
ISBN:9781305251809
Author:Jay L. Devore
Publisher:Cengage Learning
Statistics for The Behavioral Sciences (MindTap C...
Statistics
ISBN:9781305504912
Author:Frederick J Gravetter, Larry B. Wallnau
Publisher:Cengage Learning
Elementary Statistics: Picturing the World (7th E...
Statistics
ISBN:9780134683416
Author:Ron Larson, Betsy Farber
Publisher:PEARSON
The Basic Practice of Statistics
Statistics
ISBN:9781319042578
Author:David S. Moore, William I. Notz, Michael A. Fligner
Publisher:W. H. Freeman
Introduction to the Practice of Statistics
Statistics
ISBN:9781319013387
Author:David S. Moore, George P. McCabe, Bruce A. Craig
Publisher:W. H. Freeman