MATLAB: An Introduction with Applications
6th Edition
ISBN: 9781119256830
Author: Amos Gilat
Publisher: John Wiley & Sons Inc
expand_more
expand_more
format_list_bulleted
Question

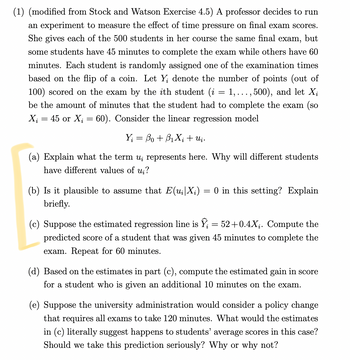
Transcribed Image Text:(1) (modified from Stock and Watson Exercise 4.5) A professor decides to run
an experiment to measure the effect of time pressure on final exam scores.
She gives each of the 500 students in her course the same final exam, but
some students have 45 minutes to complete the exam while others have 60
minutes. Each student is randomly assigned one of the examination times
based on the flip of a coin. Let Y; denote the number of points (out of
100) scored on the exam by the ith student (i = 1, ..., 500), and let X¿
be the amount of minutes that the student had to complete the exam (so
X₁ = 45 or X₂ = 60). Consider the linear regression model
Y = Bo + BıXi+uj .
(a) Explain what the term u, represents here. Why will different students
have different values of ui?
(b) Is it plausible to assume that E(u₁|X;)
briefly.
=
0 in this setting? Explain
(c) Suppose the estimated regression line is ο 52+0.4X₁. Compute the
predicted score of a student that was given 45 minutes to complete the
exam. Repeat for 60 minutes.
(d) Based on the estimates in part (c), compute the estimated gain in score
for a student who is given an additional 10 minutes on the exam.
(e) Suppose the university administration would consider a policy change
that requires all exams to take 120 minutes. What would the estimates
in (c) literally suggest happens to students' average scores in this case?
Should we take this prediction seriously? Why or why not?
Expert Solution
arrow_forward
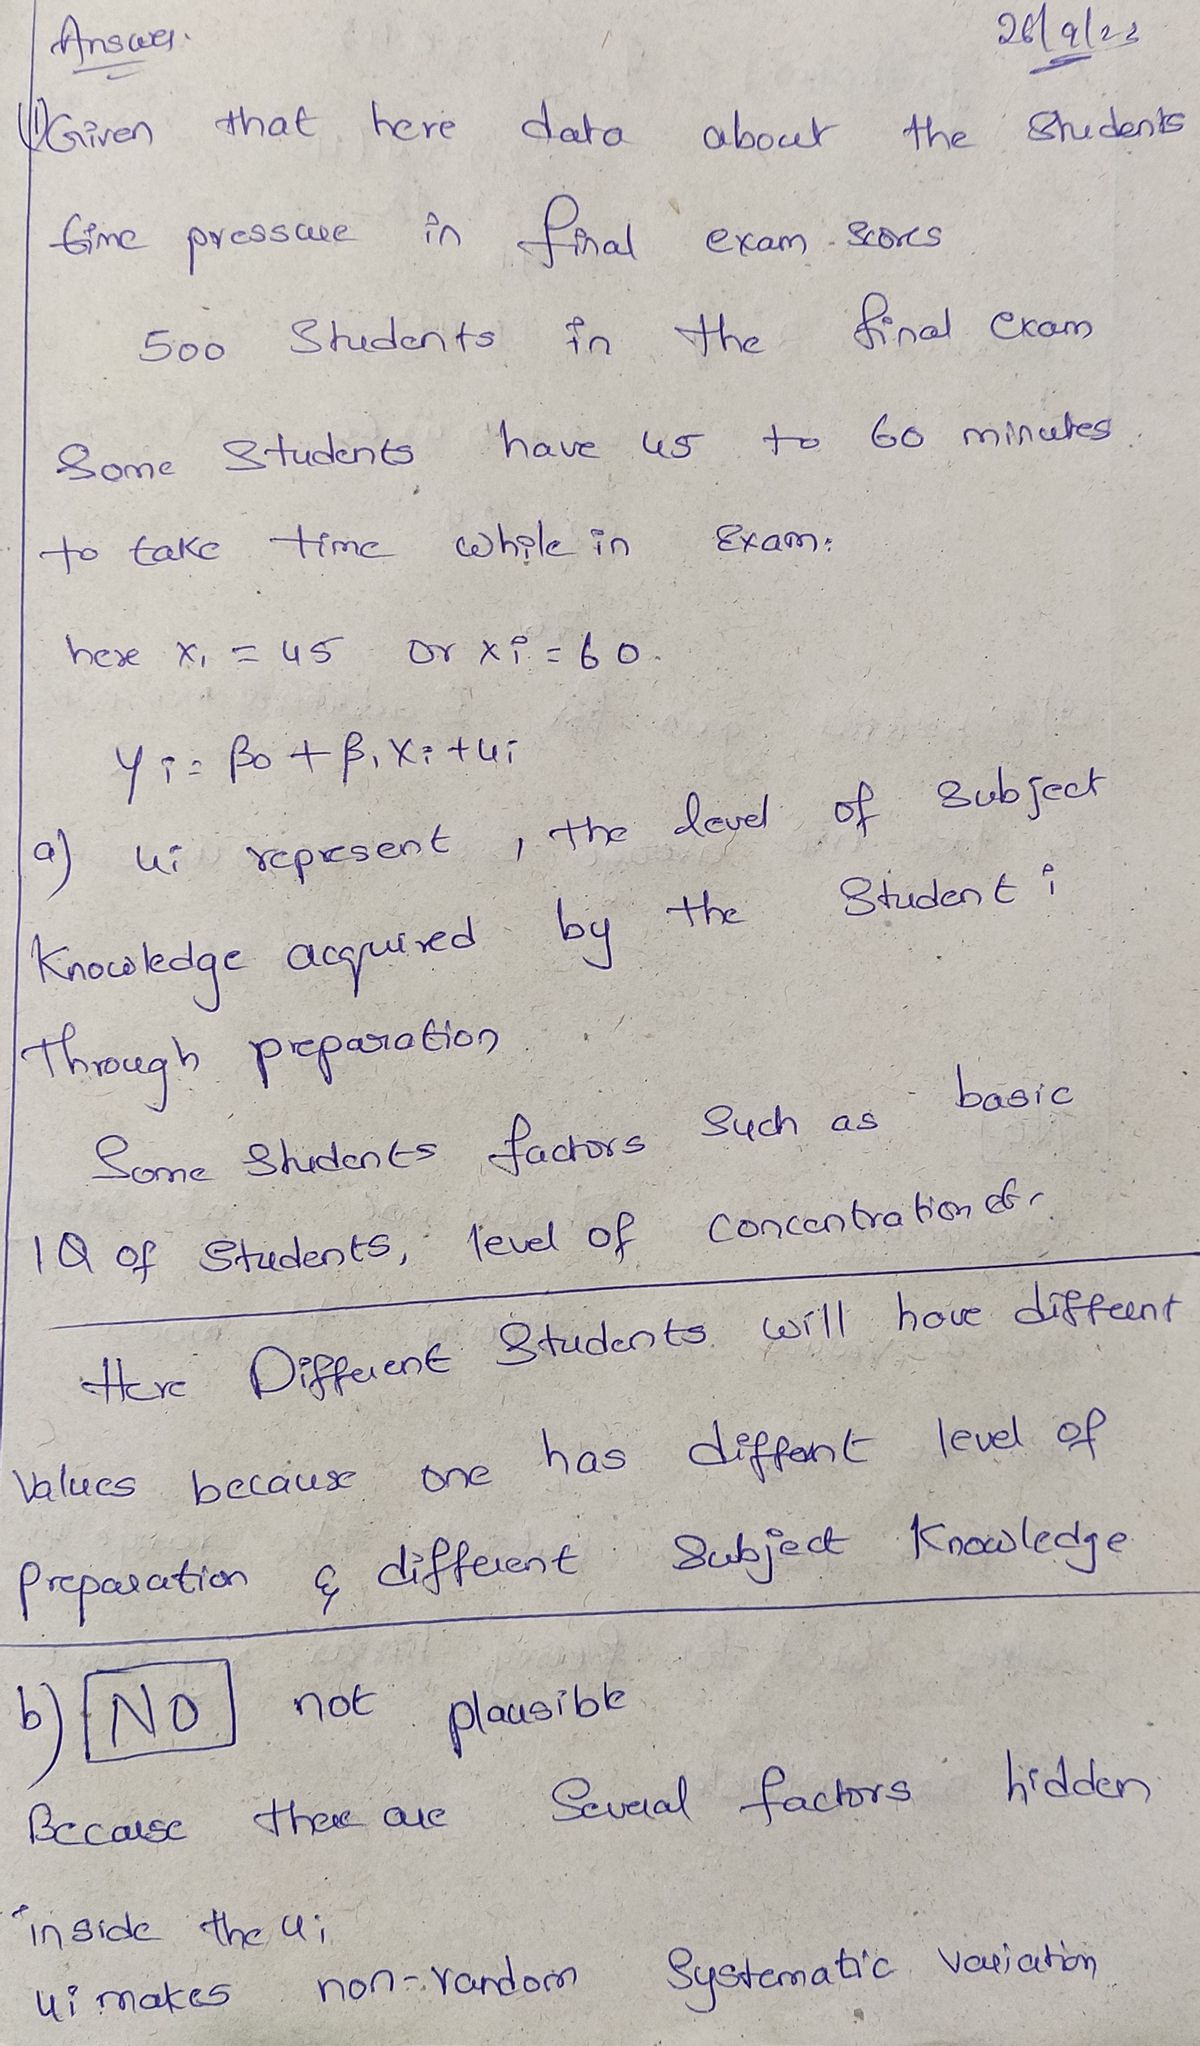
Step 1

Trending nowThis is a popular solution!
Step by stepSolved in 2 steps with 2 images

Knowledge Booster
Similar questions
- In a science fair project, Emily conducted an experiment in which she tested professional touch therapists to see if they could sense her energy field. She flipped a coin to select either her right hand or her left hand, and then she asked the therapists to identify the selected hand by placing their hand just under Emily's hand without seeing it and without touching it. Among 340 trials, the touch therapists were correct 162 times. Complete parts (a) through (d). a. Given that Emily used a coin toss to select either her right hand or her left hand, what proportion of correct responses would be expected if the touch therapists made random guesses? 0.5 (Type an integer or a decimal. Do not round.) b. Using Emily's sample results, what is the best point estimate of the therapists' success rate? (Round to three decimal places as needed.)arrow_forwardIn a science fair project, Emily conducted an experiment in which she tested professional touch therapists to see if they could sense her energy field. She flipped a coin to select either her right hand or her left hand, and then she asked the therapists to identify the selected hand by placing their hand just under Emily's hand without seeing it and without touching it. Among 331 trials, the touch therapists were correct 159 times. Complete parts (a) through (d). a. Given that Emily used a coin toss to select either her right hand or her left hand, what proportion of correct responses would be expected if the touch therapists made random guesses? (Type an integer or decial. Do not round)arrow_forwardIn a science fair project, Emily conducted an experiment in which she tested professional touch therapists to see if they could sense her energy field. She flipped a coin to select either her right hand or her left hand, and then she asked the therapists to identify the selected hand by placing their hand just under Emily's hand without seeing it and without touching it. Among 354 trials, the touch therapists were correct 170 times. Complete parts (a) through (d). a. Given that Emily used a coin toss to select either her right hand or her left hand, what proportion of correct responses would be expected if the touch therapists made random guesses? nothing (Type an integer or a decimal. Do not round.) b. Using Emily's sample results, what is the best point estimate of the therapists' success rate? nothing (Round to three decimal places as needed.) c. Using Emily's sample results, construct a 95% confidence interval estimate of the proportion of correct…arrow_forward
- In a science fair project, Emily conducted an experiment in which she tested professional touch therapists to see if they could sense her energy field. She flipped a coin to select either her right hand or her left hand, and then she asked the therapists to identify the selected hand by placing their hand just under Emily's hand without seeing it and without touching it. Among 312 trials, the touch therapists were correct 151 times. Complete parts (a) through (d). a. Given that Emily used a coin toss to select either her right hand or her left hand, what proportion of correct responses would be expected if the touch therapists made random guesses? (Type an integer or a decimal. Do not round.) b. Using Emily's sample results, what is the best point estimate of the therapists' success rate? (Round to three decimal places as needed.) c. Using Emily's sample results, construct a 90% confidence interval estimate of the proportion of correct responses made by touch therapists.arrow_forwardIn a science fair project, Emily conducted an experiment in which she tested professional touch therapists to see if they could sense her energy field. She flipped a coin to select either her right hand or her left hand, and then she asked the therapists to identify the selected hand by placing their hand just under Emily's hand without seeing it and without touching it. Among 329 trials, the touch therapists were correct 157 times. Complete parts (a) through (d). a. Given that Emily used a coin toss to select either her right hand or her left hand, what proportion of correct responses would be expected if the touch therapists made random guesses? 0.5 (Type an integer or a decimal. Do not round.) b. Using Emily's sample results, what is the best point estimate of the therapists' success rate? 0.477 (Round to three decimal places as needed.) c. Using Emily's sample results, construct a 95% confidence interval estimate of the proportion of correct responses made by touch therapists.arrow_forwardIn a science fair project, Emily conducted an experiment in which she tested professional touch Ktherapists to see if they could sense her energy field. She flipped a coin to select either her right hand or her left hand, and then she asked the therapists to identify the selected hand by placing their hand just under Emily's hand without seeing it and without touching it. Among 357 trials, the touch therapists were correct 169 times. Complete parts (a) through (d). S View an example Get more help. 4- & 87 U 0.5 (Type an integer or a decimal. Do not round.) b. Using Emily's sample results, what is the best point estimate of the therapists' success rate? 0.473 (Round to three decimal places as needed.) c. Using Emily's sample results, construct a 90% confidence interval estimate of the proportion of correct responses made by touch therapists. Farrow_forwardA college student is interested in whether presoaking time has an effect on cleanliness of clothing. He collects the dirty clothes from all of the people in his dorm and randomly assigns clothing to one of four presoak time conditions: 5 minutes, 10 minutes, 15 minutes, 20 minutes. He then asks members of another dorm to rate the cleanliness of the items (they don’t know which clothing got which soaking time). The data are presented below. C) Perform an LSD test and answer the questions that follow (SHOW ALL WORK!!! This can be on the same page as your other ANOVA hand work. Make sure it is inserted and/or uploaded): df error = tcrit (df error) MS error = s = LSD = _____________ Mean Comparisons: Mean5 min vs. Mean10 min = | ___ __ | = ___ ___ Greater than (>) LSD value? __ ___ Significant?__ ___ Mean10 min vs. Mean15 min = |__________________| = ______ Greater…arrow_forwardIn a science fair project, Emily conducted an experiment in which she tested professional touch therapists to see if they could sense her energy field. She flipped a coin to select either her right hand or her left hand, and then she asked the therapists to identify the selected hand by placing their hand just under Emily's hand without seeing it and without touching it. Among 303 trials, the touch therapists were correct 144 times. Complete parts (a) through (d). a. Given that Emily used a coin toss to select either her right hand or her left hand, what proportion of correct responses would be expected if the touch therapists made random guesses? b. Using Emily's sample results, what is the best point estimate of the therapists' success rate? c. Using Emily's sample results, construct a 90% confidence interval estimate of the proportion of correct responses made by touch therapists. d. What do the results suggest about the ability of touch therapists to select the…arrow_forwardIn a science fair project, Emily conducted an experiment in which she tested professional touch therapists to see if they could sense her energy field. She flipped a coin to select either her right hand or her left hand, and then she asked the therapists to identify the selected hand by placing their hand just under Emily's hand without seeing it and without touching it. Among 307 trials, the touch therapists were correct 143 times. Complete parts (a) through (d). a. Given that Emily used a coin toss to select either her right hand or her left hand, what proportion of correct responses would be expected if the touch therapists made random guesses? 0.5 (Type an integer or a decimal. Do not round.) b. Using Emily's sample results, what is the best point estimate of the therapists' success rate? (Round to three decimal places as needed.)arrow_forwardarrow_back_iosarrow_forward_iosRecommended textbooks for you
 MATLAB: An Introduction with ApplicationsStatisticsISBN:9781119256830Author:Amos GilatPublisher:John Wiley & Sons Inc
 Probability and Statistics for Engineering and th...StatisticsISBN:9781305251809Author:Jay L. DevorePublisher:Cengage Learning
 Statistics for The Behavioral Sciences (MindTap C...StatisticsISBN:9781305504912Author:Frederick J Gravetter, Larry B. WallnauPublisher:Cengage Learning
 Elementary Statistics: Picturing the World (7th E...StatisticsISBN:9780134683416Author:Ron Larson, Betsy FarberPublisher:PEARSON
 The Basic Practice of StatisticsStatisticsISBN:9781319042578Author:David S. Moore, William I. Notz, Michael A. FlignerPublisher:W. H. Freeman
 Introduction to the Practice of StatisticsStatisticsISBN:9781319013387Author:David S. Moore, George P. McCabe, Bruce A. CraigPublisher:W. H. Freeman
 MATLAB: An Introduction with ApplicationsStatisticsISBN:9781119256830Author:Amos GilatPublisher:John Wiley & Sons Inc
 Probability and Statistics for Engineering and th...StatisticsISBN:9781305251809Author:Jay L. DevorePublisher:Cengage Learning
 Statistics for The Behavioral Sciences (MindTap C...StatisticsISBN:9781305504912Author:Frederick J Gravetter, Larry B. WallnauPublisher:Cengage Learning
 Elementary Statistics: Picturing the World (7th E...StatisticsISBN:9780134683416Author:Ron Larson, Betsy FarberPublisher:PEARSON
 The Basic Practice of StatisticsStatisticsISBN:9781319042578Author:David S. Moore, William I. Notz, Michael A. FlignerPublisher:W. H. Freeman
 Introduction to the Practice of StatisticsStatisticsISBN:9781319013387Author:David S. Moore, George P. McCabe, Bruce A. CraigPublisher:W. H. Freeman