
MATLAB: An Introduction with Applications
6th Edition
ISBN: 9781119256830
Author: Amos Gilat
Publisher: John Wiley & Sons Inc
expand_more
expand_more
format_list_bulleted
Related questions
Question
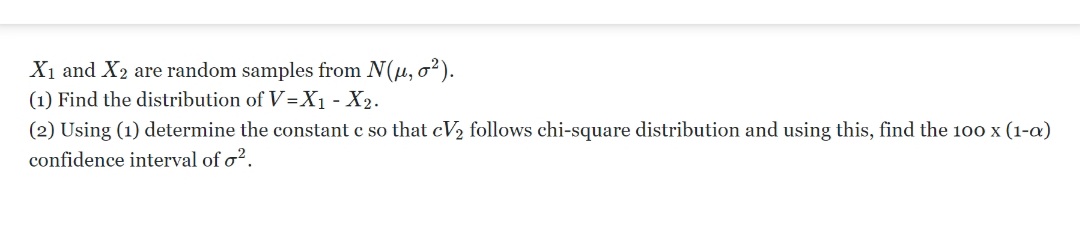

Transcribed Image Text:X₁ and X2 are random samples from N(μ, o²).
(1) Find the distribution of V=X₁ - X₂.
(2) Using (1) determine the constant c so that cV₂ follows chi-square distribution and using this, find the 100 x (1-a)
confidence interval of o².
Expert Solution
This question has been solved!
Explore an expertly crafted, step-by-step solution for a thorough understanding of key concepts.

Step by stepSolved in 2 steps

Knowledge Booster

Similar questions
- Let X₁-Bin(5, 0.2), and X2-Bin(3, 0.2). What is the distribution of Y=X₁+X₂? a. b. Please calculate P(1arrow_forwardAnswer number 4arrow_forwardStudents in a statistics course take their first exam and the class gets μ = 75.75 and σ = 7.75. The distribution is normally distributed (bell curve shaped). The professor takes all the scores and turns them into z-scores. What is true of the new z-score distribution that the professor has made? Group of answer choicesarrow_forward
- Prob & Stat 1arrow_forwardAssume y follows theX distribution. Assume c₁ and c₂ satisfy P(Y> c₁) = 0.05 and P(Y < c₂) (b). = 0.05. Then C₁ = (a) and C2 =arrow_forwardA normal distribution has μ = 30 and σ = 5. (a) Find the z score corresponding to x = 25. (Enter an exact number.) (b) Find the z score corresponding to x = 44. (Enter a number.) (c) Find the raw score corresponding to z = −3. (Enter an exact number.) (d) Find the raw score corresponding to z = 1.5. (Enter a number.)arrow_forward
- Assume a distribution with mean of 50 and a standard devivation of 12. For an x-value of 65, the z-score is . (two-decimal accuracy) For a z-score of -2.3, x = . (one-decimal accuracy)arrow_forwardZ = -0.0U 1.40 %3D Z3 -0.80 10. Find the z-score corresponding to a score of X = 45 for each of the following distributions. 40and o a. u = = 20 b. u = 40 and o = %3D 10 %3D C. u = 40 and o = 5 d. u = 40 and o = 2arrow_forwardI need to figure out the probability that component proportions produce the results X1 < 0.2 and X2 > 0.5 but I need help.arrow_forward
- I need help with question and show step by step solutionarrow_forwardWhich of the following statement is INCORRECT? If Y, follows the standard normal distribution and Y, follows a chis-square distribution with degrees of freedom n, then nY/Y t distribution. If X1,.., Xn is a random sample from a normal population with population mean 1 and variance 1, then (X -1) + (X - 1 (X, - 1) follows a chi-square distribution with degrees of freedom n. If X,..., Xn is a random sample from a normal distribution with population mean 0 and a known variance o, then must follow a distribution, where X denotes the sample mean and S denotes the sample standard deviation. If T follows at distribution with degrees of freedom n, then T must follow an F distribution with degrees of freedom 1 and n.arrow_forward
arrow_back_ios
arrow_forward_ios
Recommended textbooks for you
- MATLAB: An Introduction with ApplicationsStatisticsISBN:9781119256830Author:Amos GilatPublisher:John Wiley & Sons Inc
 Probability and Statistics for Engineering and th...StatisticsISBN:9781305251809Author:Jay L. DevorePublisher:Cengage Learning
 Statistics for The Behavioral Sciences (MindTap C...StatisticsISBN:9781305504912Author:Frederick J Gravetter, Larry B. WallnauPublisher:Cengage Learning
  Elementary Statistics: Picturing the World (7th E...StatisticsISBN:9780134683416Author:Ron Larson, Betsy FarberPublisher:PEARSON
 The Basic Practice of StatisticsStatisticsISBN:9781319042578Author:David S. Moore, William I. Notz, Michael A. FlignerPublisher:W. H. Freeman
 Introduction to the Practice of StatisticsStatisticsISBN:9781319013387Author:David S. Moore, George P. McCabe, Bruce A. CraigPublisher:W. H. Freeman
MATLAB: An Introduction with Applications
Statistics
ISBN:9781119256830
Author:Amos Gilat
Publisher:John Wiley & Sons Inc
Probability and Statistics for Engineering and th...
Statistics
ISBN:9781305251809
Author:Jay L. Devore
Publisher:Cengage Learning
Statistics for The Behavioral Sciences (MindTap C...
Statistics
ISBN:9781305504912
Author:Frederick J Gravetter, Larry B. Wallnau
Publisher:Cengage Learning
Elementary Statistics: Picturing the World (7th E...
Statistics
ISBN:9780134683416
Author:Ron Larson, Betsy Farber
Publisher:PEARSON
The Basic Practice of Statistics
Statistics
ISBN:9781319042578
Author:David S. Moore, William I. Notz, Michael A. Fligner
Publisher:W. H. Freeman
Introduction to the Practice of Statistics
Statistics
ISBN:9781319013387
Author:David S. Moore, George P. McCabe, Bruce A. Craig
Publisher:W. H. Freeman