Human Anatomy & Physiology (11th Edition)
11th Edition
ISBN: 9780134580999
Author: Elaine N. Marieb, Katja N. Hoehn
Publisher: PEARSON
expand_more
expand_more
format_list_bulleted
Concept explainers
Question
1) Does the three t-tests support the hypothesis: of manipulating light exposure will influence the flowering time of Brassica rapa plants by using light from the sun and using incandescent bulbs, or not? If it did not support the hypothesis, then what changes would you make?
2) Do these three t-tests have different growth rates?
3) Is there anything to learn about this study of the graphs and t-tests?

Transcribed Image Text:Leaf Final Count
006 in N
1
0
Graph 3:
Group 1
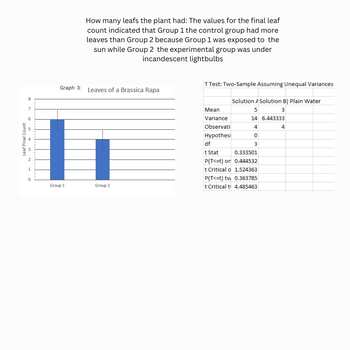
How many leafs the plant had: The values for the final leaf
count indicated that Group 1 the control group had more
leaves than Group 2 because Group 1 was exposed to the
sun while Group 2 the experimental group was under
incandescent lightbulbs
Leaves of a Brassica Rapa
Group 2
T Test: Two-Sample Assuming Unequal Variances
Mean
Variance
Observati
Hypothesi
Solution A Solution B) Plain Water
5
3
14 6.443333
4
0
3
df
t Stat
0.333501
P(T<=t) or 0.444532
t Critical o 1.524363
P(T<=t) tw 0.363785
t Critical t 4.485463
4

Transcribed Image Text:Plants in (cm)
9
8
7
6
0
Plant Development in (cm)
Graph 1:
Graph 2:
14
12
10
8
0
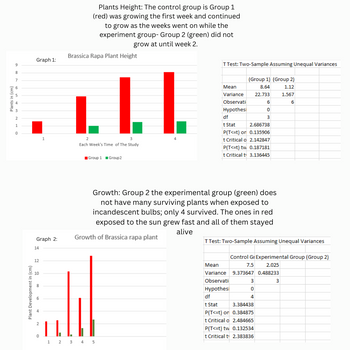
Plants Height: The control group is Group 1
(red) was growing the first week and continued
to grow as the weeks went on while the
experiment group- Group 2 (green) did not
grow at until week 2.
Brassica Rapa Plant Height
LLL
2
3
Each Week's Time of The Study
Group 1 Group2
T Test: Two-Sample Assuming Unequal Variances
1 2 3 4 5
(Group 1) (Group 2)
8.64
1.12
22.733
1.567
6
Mean
Variance
Observati
Hypothesi
df
t Stat 2.686738
P(T<=t) or 0.135906
t Critical o 2.142847
P(T<=t) tw 0.187181
t Critical t 3.136445
Growth: Group 2 the experimental group (green) does
not have many surviving plants when exposed to
incandescent bulbs; only 4 survived. The ones in red
exposed to the sun grew fast and all of them stayed
alive
Growth of Brassica rapa plant
T Test: Two-Sample Assuming Unequal Variances
Control Gr Experimental Group (Group 2)
Mean
7.5 2.025
Variance 9.373647 0.488233
Observati
3
Hypothesi
3
0
4
6
0
3
df
t Stat
3.384438
P(T<=t) or 0.384875
t Critical o 2.484665
P(T<=t) tw
0.132534
t Critical t 2.383836
Expert Solution
This question has been solved!
Explore an expertly crafted, step-by-step solution for a thorough understanding of key concepts.
Step by stepSolved in 4 steps

Knowledge Booster
Learn more about
Need a deep-dive on the concept behind this application? Look no further. Learn more about this topic, biology and related others by exploring similar questions and additional content below.Similar questions
- Please Aspaarrow_forward4. A student investigated the effect of plant growth substances (IAA and GA) on the elongation of pea stems, the students marked a 10mm length of stem on each of four plants and applied growth substances to the stem. Figure 2 shows a graph of the student's results. Length of stem section (mm) 161 14- 12- 10+ 0 Describe b) c) Suggest a suite 10 ************ 20 30 Time (h) 40 IAA and GA IAA GA control 50 60 minem & wth of the co crease in length of 4.9mm. The movime after application of growth substances was 4.2min. Calculate the percentage mereas (2) treatment for the control (2 d) Suggest how the student could have improved their investigation (5) sepere *********** ************arrow_forwardThe image below represents a flower meristem viewed from above. At the time the image represents, the cells are undifferentiated, although their eventual fates are determined (e.g. carpels, etc.). The rectangles indicate the regions of the meristem where particular genes (A, B, and C) are expressed. Note that these genes are expressed all around the circumference of the meristem at the location indicated; in other words, gene A is active in all cells in the rings labeled sepal and petals. Interpret the figure by filling in the following table: I've numbered each row to help with writing the answer below. Determined by the activity of which gene(s) - A,B,C? Organ Carpel 1. Stamen 2. Petal 3 Sepal 4 Sepals Petals Stamens Bn Carpelsarrow_forward
- 1. (i) List five response variables that should be determined in a callus induction experiment (ii) List five terms that describe texture of callus (iii) List five terms that describe colour of callus (iv) What is the sign of ethylene poisoning in a callus culture (v) Provide three applications of cell suspension culture Sub-parts (iv) and (v) were not solved but the preceding sub-parts have already been solvedarrow_forwardThe drooping, bell-like flower Aquilegia canadensis is adapted for cross-pollination. However, if the plant has not been pollinated previously, self-pollination can occur. However, if cross pollination occurs after self-pollination takes place, the pollen from cross pollination reaches the style before the pollen from self-pollination. Using course concepts and vocabulary 1) Provide a reasoning for this phenomenon. 2) Would this adaptation for reproduction be beneficial for the plant?arrow_forwardThe Effect of Light Stress on Germination and Growth Parameters of Corchorus olitorius, Celosia argentea, Amaranthus. What is the difference of this experiment to any other similar experiment?arrow_forward
- In their experiments with the flowers of Begonia involucrate, Agren and Schemske (1991) observed that there was a trade-off between what two characteristics? Size of flower and number of flowers on inflorescence Size of flower and pollination Annual versus perennial reproduction O Time and expense to grow the pollen tube versus cost of maintaining the flower on the treearrow_forwardFlowers and Trees Select an Exercise: 2 0 0 0 0 1000 800 600 400 200 Controls GO SM2 Peak G STEP STOP Peak 1 D RESET B D -Petal Tips Year Peak 7 808 Pelal Color C Anthers Sligmas Spur Color Growing Tree lools R -Spur length 1111 In the picture, what phenotypes differ among flowers on Peaks 3 and 4? Petal tips. Blade color and stripes. There are no different phenotypes. Blade color only. Stripes only. Peak 2 E lab notebook Peak 5 Close find bar COM Peak 3 A MM Peak 4 Blade Color Stripesarrow_forwardGametophytes of the C-fern were described in Table 1 (p. 281) and their sporophyte offspring were described in Table 2 (p. 282). The following questions are based on the class data totals. 1. What was the proportion (frequency or percentage) of the dominant and recessive alleles in the gametophyte generation? 2. What was the proportion (frequency or percentage) of the dominant and recessive alleles in the sporophyte generation? 3. Using Hardy-Weinberg Equilibrium equation, what are the expected genotypes of the sporophyte generation in Hardy-Weinberg Equilibrium based on the population of the gametophytes? 4. Was this population in Hardy-Weinberg Equilibrium? If so, why is that expected? If not, what possible reason could explain the results? Table 1. Gametophyte phenotypes w et slagal Date data recorded 10/17/23doo beo neizivib loo in aqua te// Phenotype Description solid green polka dot Phenotype Description Solid green Group 1 69 58 Polka dot Number of Gametophytes Per Group Group…arrow_forward
arrow_back_ios
arrow_forward_ios
Recommended textbooks for you
 Human Anatomy & Physiology (11th Edition)BiologyISBN:9780134580999Author:Elaine N. Marieb, Katja N. HoehnPublisher:PEARSON
 Biology 2eBiologyISBN:9781947172517Author:Matthew Douglas, Jung Choi, Mary Ann ClarkPublisher:OpenStax
 Anatomy & PhysiologyBiologyISBN:9781259398629Author:McKinley, Michael P., O'loughlin, Valerie Dean, Bidle, Theresa StouterPublisher:Mcgraw Hill Education,
 Molecular Biology of the Cell (Sixth Edition)BiologyISBN:9780815344322Author:Bruce Alberts, Alexander D. Johnson, Julian Lewis, David Morgan, Martin Raff, Keith Roberts, Peter WalterPublisher:W. W. Norton & Company
 Laboratory Manual For Human Anatomy & PhysiologyBiologyISBN:9781260159363Author:Martin, Terry R., Prentice-craver, CynthiaPublisher:McGraw-Hill Publishing Co.
 Inquiry Into Life (16th Edition)BiologyISBN:9781260231700Author:Sylvia S. Mader, Michael WindelspechtPublisher:McGraw Hill Education

Human Anatomy & Physiology (11th Edition)
Biology
ISBN:9780134580999
Author:Elaine N. Marieb, Katja N. Hoehn
Publisher:PEARSON

Biology 2e
Biology
ISBN:9781947172517
Author:Matthew Douglas, Jung Choi, Mary Ann Clark
Publisher:OpenStax

Anatomy & Physiology
Biology
ISBN:9781259398629
Author:McKinley, Michael P., O'loughlin, Valerie Dean, Bidle, Theresa Stouter
Publisher:Mcgraw Hill Education,

Molecular Biology of the Cell (Sixth Edition)
Biology
ISBN:9780815344322
Author:Bruce Alberts, Alexander D. Johnson, Julian Lewis, David Morgan, Martin Raff, Keith Roberts, Peter Walter
Publisher:W. W. Norton & Company

Laboratory Manual For Human Anatomy & Physiology
Biology
ISBN:9781260159363
Author:Martin, Terry R., Prentice-craver, Cynthia
Publisher:McGraw-Hill Publishing Co.

Inquiry Into Life (16th Edition)
Biology
ISBN:9781260231700
Author:Sylvia S. Mader, Michael Windelspecht
Publisher:McGraw Hill Education