
Applications and Investigations in Earth Science (9th Edition)
9th Edition
ISBN: 9780134746241
Author: Edward J. Tarbuck, Frederick K. Lutgens, Dennis G. Tasa
Publisher: PEARSON
expand_more
expand_more
format_list_bulleted
Related questions
Question
Part A
https://mynasadata.larc.nasa.gov/EarthSystemLAS/UI.vm
You’ll start by investigating how Earth’s surface temperature varies.
Open My NASA Data, and click on Data Set in the top left corner of the
page. Within the Atmosphere category, select All Data, then select
Temperature. Now, select Monthly Air Surface Temperatures. After the
new map appears on your screen, select the Animate option near the top
of the page, and then select OK to see the animation. Set the time
range on the animation for the most recent five years, and then click
Submit. You can control the speed of the animation with the controls
beneath the map.
Question 1
Describe patterns you observe in Earth’s surface temperature. How do
these patterns change during the course of a year and from year to
year? Use lines of latitude and degrees Celsius in your description.
15px
Space used (includes formatting): 0 / 15000
Question 2
What causes the variations in Earth’s surface temperature during the
course of a year at a given location? What causes the similar
temperature bands that repeat from year to year?

Transcribed Image Text:.google.com/document/d/1MPDVHYTA2Krj4Vk4MvlzFcNg_vwroZhMoOz9x2AMSe8/edit
hit Activity ☆
w Tools Help
Data Set
One Chart Annotations
Chart Options
Update Chart <
179 69 E
SON
90 S
179 09 E
Display Link Animate Google Earth Show Values Export to Desktop Application Download Data
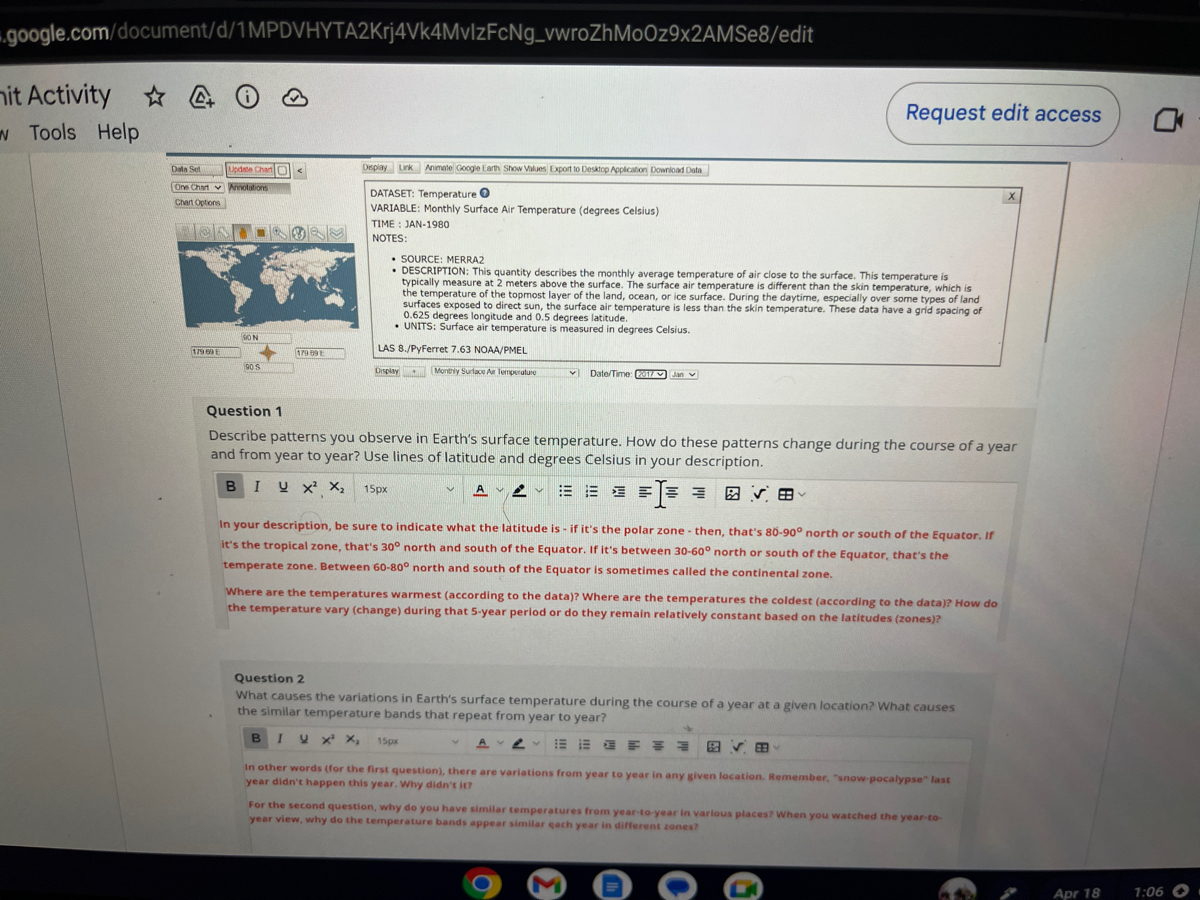
DATASET: Temperature
VARIABLE: Monthly Surface Air Temperature (degrees Celsius)
TIME: JAN-1980
NOTES:
SOURCE: MERRA2
• DESCRIPTION: This quantity describes the monthly average temperature of air close to the surface. This temperature is
typically measure at 2 meters above the surface. The surface air temperature is different than the skin temperature, which is
the temperature of the topmost layer of the land, ocean, or ice surface. During the daytime, especially over some types of land
surfaces exposed to direct sun, the surface air temperature is less than the skin temperature. These data have a grid spacing of
0.625 degrees longitude and 0.5 degrees latitude.
• UNITS: Surface air temperature is measured in degrees Celsius.
LAS 8./PyFerret 7.63 NOAA/PMEL
Display Monthly Surface Ar Temperature
v Date/Time: 27 Jan
Question 1
Describe patterns you observe in Earth's surface temperature. How do these patterns change during the course of a year
and from year to year? Use lines of latitude and degrees Celsius in your description.
BI U X² X₂ 15px
AYA
In your description, be sure to indicate what the latitude is - if it's the polar zone - then, that's 80-90° north or south of the Equator. If
it's the tropical zone, that's 30° north and south of the Equator. If it's between 30-60° north or south of the Equator, that's the
temperate zone. Between 60-80° north and south of the Equator is sometimes called the continental zone.
Request edit access
Where are the temperatures warmest (according to the data)? Where are the temperatures the coldest (according to the data)? How do
the temperature vary (change) during that 5-year period or do they remain relatively constant based on the latitudes (zones)?
V
Question 2
What causes the variations in Earth's surface temperature during the course of a year at a given location? What causes
the similar temperature bands that repeat from year to year?
B IV X² X, 15px
F
M
VE BBM
In other words (for the first question), there are variations from year to year in any given location. Remember, "snow-pocalypse" last
year didn't happen this year. Why didn't it?
For the second question, why do you have similar temperatures from year-to-year in various places? When you watched the year-to-
year view, why do the temperature bands appear similar each year in different zones?
OO
G
X
Apr 18
1:06 O
Expert Solution
This question has been solved!
Explore an expertly crafted, step-by-step solution for a thorough understanding of key concepts.

This is a popular solution

Trending nowThis is a popular solution!

Step by stepSolved in 4 steps

Knowledge Booster

Recommended textbooks for you
- Applications and Investigations in Earth Science ...Earth ScienceISBN:9780134746241Author:Edward J. Tarbuck, Frederick K. Lutgens, Dennis G. TasaPublisher:PEARSON
 Exercises for Weather & Climate (9th Edition)Earth ScienceISBN:9780134041360Author:Greg CarbonePublisher:PEARSON
 Environmental ScienceEarth ScienceISBN:9781260153125Author:William P Cunningham Prof., Mary Ann Cunningham ProfessorPublisher:McGraw-Hill Education
  Earth Science (15th Edition)Earth ScienceISBN:9780134543536Author:Edward J. Tarbuck, Frederick K. Lutgens, Dennis G. TasaPublisher:PEARSON
 Environmental Science (MindTap Course List)Earth ScienceISBN:9781337569613Author:G. Tyler Miller, Scott SpoolmanPublisher:Cengage Learning
 Physical GeologyEarth ScienceISBN:9781259916823Author:Plummer, Charles C., CARLSON, Diane H., Hammersley, LisaPublisher:Mcgraw-hill Education,
Applications and Investigations in Earth Science ...
Earth Science
ISBN:9780134746241
Author:Edward J. Tarbuck, Frederick K. Lutgens, Dennis G. Tasa
Publisher:PEARSON
Exercises for Weather & Climate (9th Edition)
Earth Science
ISBN:9780134041360
Author:Greg Carbone
Publisher:PEARSON
Environmental Science
Earth Science
ISBN:9781260153125
Author:William P Cunningham Prof., Mary Ann Cunningham Professor
Publisher:McGraw-Hill Education
Earth Science (15th Edition)
Earth Science
ISBN:9780134543536
Author:Edward J. Tarbuck, Frederick K. Lutgens, Dennis G. Tasa
Publisher:PEARSON
Environmental Science (MindTap Course List)
Earth Science
ISBN:9781337569613
Author:G. Tyler Miller, Scott Spoolman
Publisher:Cengage Learning
Physical Geology
Earth Science
ISBN:9781259916823
Author:Plummer, Charles C., CARLSON, Diane H., Hammersley, Lisa
Publisher:Mcgraw-hill Education,