MATLAB: An Introduction with Applications
6th Edition
ISBN: 9781119256830
Author: Amos Gilat
Publisher: John Wiley & Sons Inc
expand_more
expand_more
format_list_bulleted
Question

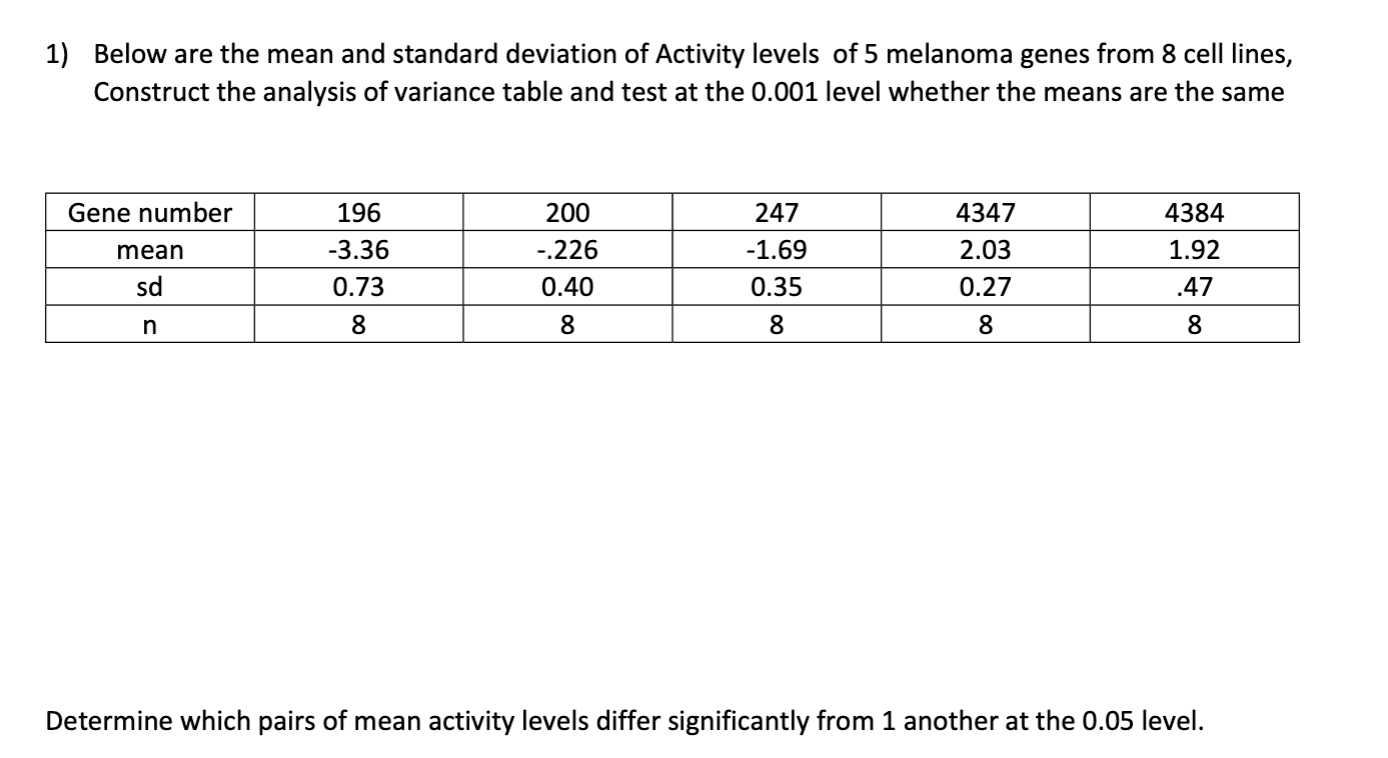
Transcribed Image Text:1) Below are the mean and standard deviation of Activity levels of 5 melanoma genes from 8 cell lines,
Construct the analysis of variance table and test at the 0.001 level whether the means are the same
Gene number
196
200
247
4347
4384
mean
-3.36
-.226
-1.69
2.03
1.92
sd
0.73
0.40
0.35
0.27
.47
8.
8.
8.
Determine which pairs of mean activity levels differ significantly from 1 another at the 0.05 level.
Expert Solution
This question has been solved!
Explore an expertly crafted, step-by-step solution for a thorough understanding of key concepts.
This is a popular solution
Trending nowThis is a popular solution!
Step by stepSolved in 4 steps with 2 images

Knowledge Booster
Similar questions
- The Insurance Institute for Highway Safety publishes data on the total damage suffered by compact automobiles in a series of controlled, low-speed collisions. The cost for a sample of 9 cars, in hundreds of dollars, is provided below. 10, 6, 8, 10, 5, 3.5, 7.5, 7,9.5 Find interquartile range for mileage data and value of variance.arrow_forwardOn average, ages of people in a sample deviate from the mean by 3.23 years. Find the variance. Do not round your answe Submit Question Online ver Proctor om MacBook Pro G Search or type URL 6arrow_forwardA researchers says that 50% of the variance in blood pressure can be predicted from HR and that blood pressure is postively associated with HR. What is the correlation between blood pressure and HR?arrow_forward
- Another idea is to look at how a team's payroll impacts its home attendance. Higher payroll usually signals more higher-skilled players on a roster which should brings fans to the ballpark to see these players. Create 2 samples based on Team Salary and calculate average attendance, variance of attendance, and standard deviation of attendance for each sample. Sample 1 = 10 teams with the highest team salary Sample 2 = 10 teams with the lowest team salary Tip: Use Excel's sorting tool to sort the data by salary (highest to lowest), and copy the 10 highest and 10 lowest into a separate part of the spreadsheet for easier analysis. Sample 1 Sample 2 Top 10 Team Salary Bottom 10 Team Salary Sample mean attendance mil mil Sample attendance variance mil mil Sample attendance standard deviation mil mil Perform a hypothesis test to determine whether there is a difference in the mean attendance of teams between the two groups…arrow_forwardA researcher found a significant correlation of .12 between gender (coded as 0 = ‘male’ and 1 = ‘female’) and number of friends at university. If the assigned values of gender were changed to 1 = ‘female’ and 2 = ‘male’, how would this affect the correlation? The strength of the relationship would become weaker The amount of variance explained by the relationship would increase It would become nonsignificantThe sign would change to become negative A researcher is trying to predict anxiety (measured on a 7-point scale) from exposure to stress (operationalised as the number of stressful life events participants can recall in the last week). She has found a correlation coefficient of r = .54 between anxiety and stress, with a standard deviation of 4.45 for anxiety and a variance of 17.21 for stress. What other information is needed to calculate b? The sums of squares of stressThe sums of products of anxiety and stress The covariance of anxiety and stressNo other information is…arrow_forwardThe maximum weights (in kilograms) for which one repetition of a half squat can be performed and the times (in seconds) to run a 10-meter sprint for 12 international soccer players are shown in the attached data table with a sample correlation coefficient r of - 0.958. A 13th data point was added to the end of the data set for an international soccer player who can perform the half squat with a maximum of 210 kilograms and can sprint 10 meters in 1.99 seconds. Describe how this affects the correlation coefficient r. Use technology. Click the icon to view the data set. Data Table The new correlation coefficient r going from - 0.958 to (Round to three decimal places as needed.) Maximum weight, x Time, y 175 1.81 185 1.79 155 2.06 210 1.42 155 2.07 195 1.62 190 1.69 165 1.88 195 1.59 180 1.64 165 1.97 175 1.91 210 1.99arrow_forward
arrow_back_ios
arrow_forward_ios
Recommended textbooks for you
 MATLAB: An Introduction with ApplicationsStatisticsISBN:9781119256830Author:Amos GilatPublisher:John Wiley & Sons Inc
 Probability and Statistics for Engineering and th...StatisticsISBN:9781305251809Author:Jay L. DevorePublisher:Cengage Learning
 Statistics for The Behavioral Sciences (MindTap C...StatisticsISBN:9781305504912Author:Frederick J Gravetter, Larry B. WallnauPublisher:Cengage Learning
 Elementary Statistics: Picturing the World (7th E...StatisticsISBN:9780134683416Author:Ron Larson, Betsy FarberPublisher:PEARSON
 The Basic Practice of StatisticsStatisticsISBN:9781319042578Author:David S. Moore, William I. Notz, Michael A. FlignerPublisher:W. H. Freeman
 Introduction to the Practice of StatisticsStatisticsISBN:9781319013387Author:David S. Moore, George P. McCabe, Bruce A. CraigPublisher:W. H. Freeman

MATLAB: An Introduction with Applications
Statistics
ISBN:9781119256830
Author:Amos Gilat
Publisher:John Wiley & Sons Inc

Probability and Statistics for Engineering and th...
Statistics
ISBN:9781305251809
Author:Jay L. Devore
Publisher:Cengage Learning

Statistics for The Behavioral Sciences (MindTap C...
Statistics
ISBN:9781305504912
Author:Frederick J Gravetter, Larry B. Wallnau
Publisher:Cengage Learning

Elementary Statistics: Picturing the World (7th E...
Statistics
ISBN:9780134683416
Author:Ron Larson, Betsy Farber
Publisher:PEARSON

The Basic Practice of Statistics
Statistics
ISBN:9781319042578
Author:David S. Moore, William I. Notz, Michael A. Fligner
Publisher:W. H. Freeman

Introduction to the Practice of Statistics
Statistics
ISBN:9781319013387
Author:David S. Moore, George P. McCabe, Bruce A. Craig
Publisher:W. H. Freeman