
Introductory Circuit Analysis (13th Edition)
13th Edition
ISBN: 9780133923605
Author: Robert L. Boylestad
Publisher: PEARSON
expand_more
expand_more
format_list_bulleted
Related questions
Question
thumb_up100%
please do 1 and 2 in MATLAB,will give like
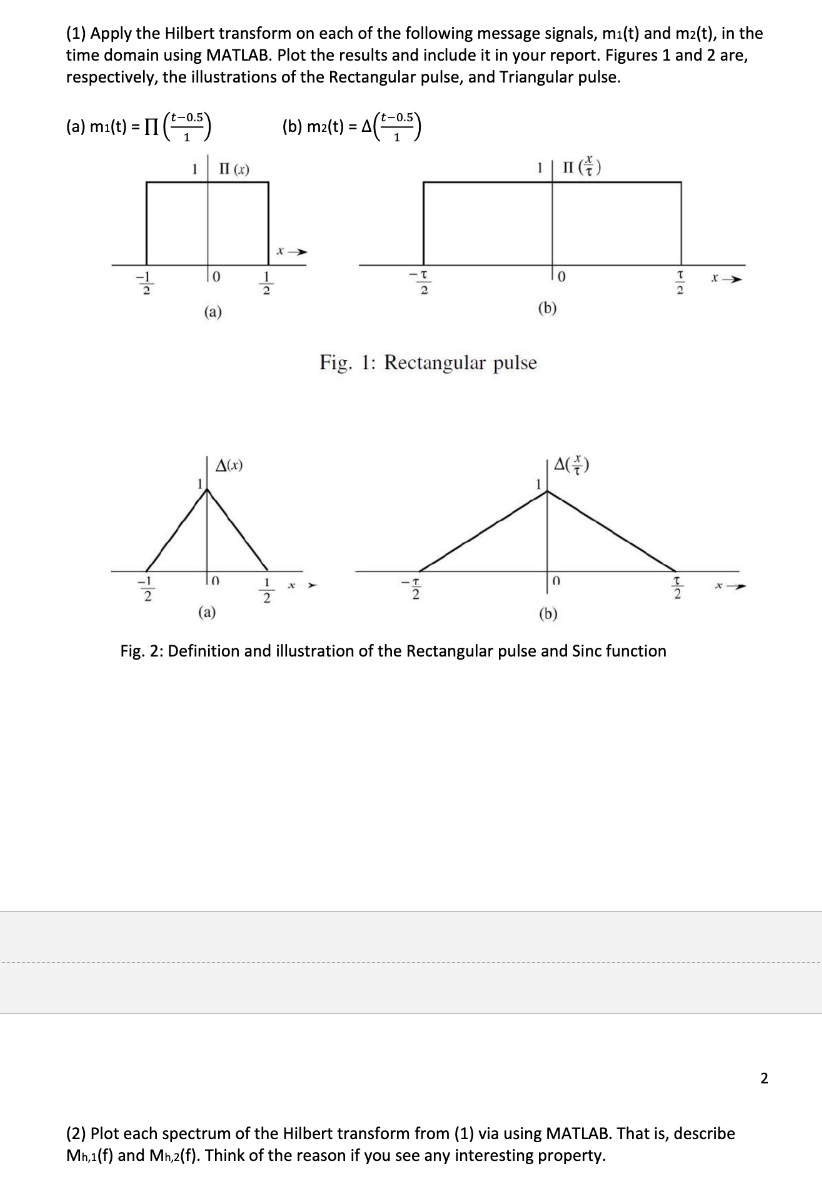

Transcribed Image Text:(1) Apply the Hilbert transform on each of the following message signals, mi(t) and m²(t), in the
time domain using MATLAB. Plot the results and include it in your report. Figures 1 and 2 are,
respectively, the illustrations of the Rectangular pulse, and Triangular pulse.
(a) mi(t) = (5)
II (x)
(b) m2(t) = A
= A (t−0.5)
1❘ (†)
10
(a)
Fig. 1: Rectangular pulse
(b)
#t
A(x)
A(+)
0
(a)
n
(b)
Fig. 2: Definition and illustration of the Rectangular pulse and Sinc function
(2) Plot each spectrum of the Hilbert transform from (1) via using MATLAB. That is, describe
Mh,1(f) and Mh,2(f). Think of the reason if you see any interesting property.
2
Expert Solution
This question has been solved!
Explore an expertly crafted, step-by-step solution for a thorough understanding of key concepts.

Step by stepSolved in 2 steps with 5 images

Knowledge Booster

Similar questions
- FIND io and Vo ( NEED NEAT HANDWRITTEN SOLUTION ONLY OTHERWISE DOWNVOTE).arrow_forwardUsing Kinchoffig Voltage law Find the Voltage Vi given Vxtarrow_forwardA meter having 0-1000HA range and 10000 resistance is required to be changed to O-100 mA meter. The value of shunt resistance is aboutarrow_forward
arrow_back_ios
arrow_forward_ios
Recommended textbooks for you
- Introductory Circuit Analysis (13th Edition)Electrical EngineeringISBN:9780133923605Author:Robert L. BoylestadPublisher:PEARSON
 Delmar's Standard Textbook Of ElectricityElectrical EngineeringISBN:9781337900348Author:Stephen L. HermanPublisher:Cengage Learning
 Programmable Logic ControllersElectrical EngineeringISBN:9780073373843Author:Frank D. PetruzellaPublisher:McGraw-Hill Education
  Fundamentals of Electric CircuitsElectrical EngineeringISBN:9780078028229Author:Charles K Alexander, Matthew SadikuPublisher:McGraw-Hill Education
 Electric Circuits. (11th Edition)Electrical EngineeringISBN:9780134746968Author:James W. Nilsson, Susan RiedelPublisher:PEARSON
 Engineering ElectromagneticsElectrical EngineeringISBN:9780078028151Author:Hayt, William H. (william Hart), Jr, BUCK, John A.Publisher:Mcgraw-hill Education,
Introductory Circuit Analysis (13th Edition)
Electrical Engineering
ISBN:9780133923605
Author:Robert L. Boylestad
Publisher:PEARSON
Delmar's Standard Textbook Of Electricity
Electrical Engineering
ISBN:9781337900348
Author:Stephen L. Herman
Publisher:Cengage Learning
Programmable Logic Controllers
Electrical Engineering
ISBN:9780073373843
Author:Frank D. Petruzella
Publisher:McGraw-Hill Education
Fundamentals of Electric Circuits
Electrical Engineering
ISBN:9780078028229
Author:Charles K Alexander, Matthew Sadiku
Publisher:McGraw-Hill Education
Electric Circuits. (11th Edition)
Electrical Engineering
ISBN:9780134746968
Author:James W. Nilsson, Susan Riedel
Publisher:PEARSON
Engineering Electromagnetics
Electrical Engineering
ISBN:9780078028151
Author:Hayt, William H. (william Hart), Jr, BUCK, John A.
Publisher:Mcgraw-hill Education,