
MATLAB: An Introduction with Applications
6th Edition
ISBN: 9781119256830
Author: Amos Gilat
Publisher: John Wiley & Sons Inc
expand_more
expand_more
format_list_bulleted
Related questions
Concept explainers
Topic Video
Question
Conditions are counted data conditiom, independece assumption, randomization condition, 10% condition and expected cell frequency condition. Please show work by hand or written.
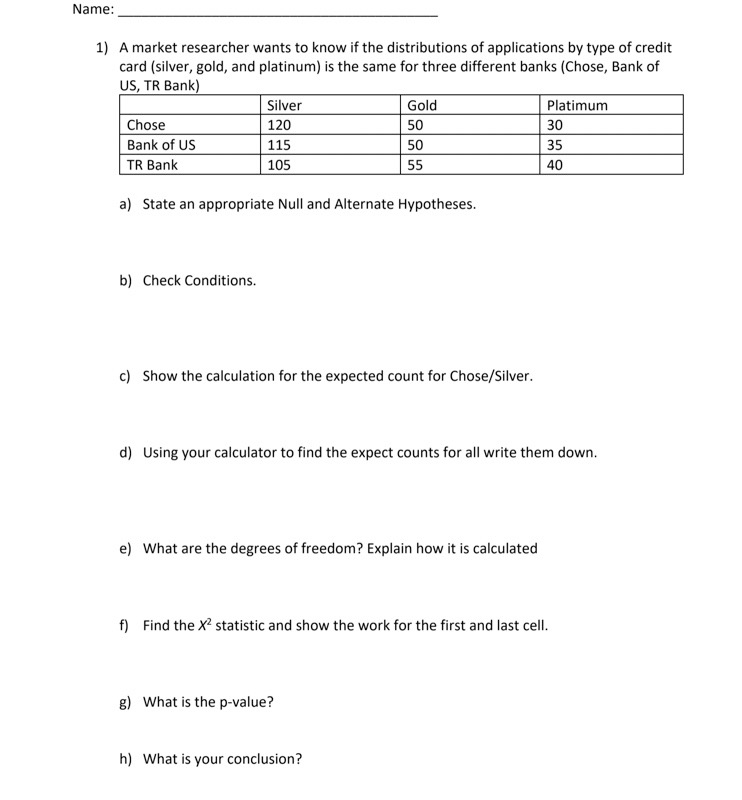

Transcribed Image Text:Name:
1) A market researcher wants to know if the distributions of applications by type of credit
card (silver, gold, and platinum) is the same for three different banks (Chose, Bank of
US, TR Bank)
Silver
Gold
Platimum
Chose
120
50
30
Bank of US
115
50
35
TR Bank
105
55
40
a) State an appropriate Null and Alternate Hypotheses.
b) Check Conditions.
c) Show the calculation for the expected count for Chose/Silver.
d) Using your calculator to find the expect counts for all write them down.
e) What are the degrees of freedom? Explain how it is calculated
f) Find the X statistic and show the work for the first and last cell.
g) What is the p-value?
h) What is your conclusion?
Expert Solution
This question has been solved!
Explore an expertly crafted, step-by-step solution for a thorough understanding of key concepts.

This is a popular solution

Trending nowThis is a popular solution!

Step by stepSolved in 2 steps

Knowledge Booster


Learn more about
Need a deep-dive on the concept behind this application? Look no further. Learn more about this topic, statistics and related others by exploring similar questions and additional content below.Similar questions
- Report summary statistics for the two variables ‘Run_Pulse’ and ‘Rest_Pulse’ in the table below: Sample Size Minimum Maximum Mean Median Standard Deviation Standard Error Run_Pulse Rest_Pulsearrow_forwardAutoSave OFF Home Insert Draw Design Layout Paste Page 4 of 4 B I vab References A^ A Aa v A 1115 words English (United States) As A v Av 18 W Using Excel for Hypothesis Testing with Two Means - Read-Only - Saved to my Mac Mailings = Review V V View Treated with multivitamin 트 쉰 E V Treated with placebo Tell me V 4. (z Test (in Excel) for Two Samples with Known Variance) A random selection of volunteers at a research institute have been exposed to a typical cold virus. After they started to have cold symptoms, 10 of them were given multivitamin tablets daily which contain grams of vitamin C and various other vitamins and minerals. The remaining 10 volunteers were given placebo tablets. For each individual, the length of time taken to recover from cold is recorded. At the end of the experiment following data are obtained: i. ii. Accessibility: Investigate AaBbCcDdEe Normal AaBb CcDdEe No Spacing Days to recover from cold 4.4, 6.5, 4.7, 4.5, 3.6, 5.0, 5.6, 6.6, 2.7, 5.5 It is known that…arrow_forwardthe central limit theorem informs the numerator of the z- score for the sample means equation. true or false?arrow_forward
- The null and alternative hypotheses for a population proportion, as well as the sample results, are given. Use StatKey or other technology to generate a randomization distribution and calculate a p-value. StatKey tip: Use "Test for a Single Proportion" and then "Edit Data" to enter the sample information. Hypotheses: H0:p=0.5 vs Ha:p<0.5;Sample data: p^=38100=0.38 with n=100 Round the p-value to three decimal places.arrow_forwardPlease help ASaparrow_forwardChapter 4, Section 2, Exercise 049 The null and alternative hypotheses for a test are given, as well as some information about the actual sample and the statistic that is computed for each randomization sample. Indicate where the randomization distribution will be centered. H0:p1=p2 vs Ha:p1<p2Sample: p1^=0.3, n=20, p^2=0.167, n=12Randomization statistic: p^1-p^2 Enter your answer in accordance to the question statementarrow_forward
arrow_back_ios
arrow_forward_ios
Recommended textbooks for you
- MATLAB: An Introduction with ApplicationsStatisticsISBN:9781119256830Author:Amos GilatPublisher:John Wiley & Sons Inc
 Probability and Statistics for Engineering and th...StatisticsISBN:9781305251809Author:Jay L. DevorePublisher:Cengage Learning
 Statistics for The Behavioral Sciences (MindTap C...StatisticsISBN:9781305504912Author:Frederick J Gravetter, Larry B. WallnauPublisher:Cengage Learning
  Elementary Statistics: Picturing the World (7th E...StatisticsISBN:9780134683416Author:Ron Larson, Betsy FarberPublisher:PEARSON
 The Basic Practice of StatisticsStatisticsISBN:9781319042578Author:David S. Moore, William I. Notz, Michael A. FlignerPublisher:W. H. Freeman
 Introduction to the Practice of StatisticsStatisticsISBN:9781319013387Author:David S. Moore, George P. McCabe, Bruce A. CraigPublisher:W. H. Freeman
MATLAB: An Introduction with Applications
Statistics
ISBN:9781119256830
Author:Amos Gilat
Publisher:John Wiley & Sons Inc
Probability and Statistics for Engineering and th...
Statistics
ISBN:9781305251809
Author:Jay L. Devore
Publisher:Cengage Learning
Statistics for The Behavioral Sciences (MindTap C...
Statistics
ISBN:9781305504912
Author:Frederick J Gravetter, Larry B. Wallnau
Publisher:Cengage Learning
Elementary Statistics: Picturing the World (7th E...
Statistics
ISBN:9780134683416
Author:Ron Larson, Betsy Farber
Publisher:PEARSON
The Basic Practice of Statistics
Statistics
ISBN:9781319042578
Author:David S. Moore, William I. Notz, Michael A. Fligner
Publisher:W. H. Freeman
Introduction to the Practice of Statistics
Statistics
ISBN:9781319013387
Author:David S. Moore, George P. McCabe, Bruce A. Craig
Publisher:W. H. Freeman