
MATLAB: An Introduction with Applications
6th Edition
ISBN: 9781119256830
Author: Amos Gilat
Publisher: John Wiley & Sons Inc
expand_more
expand_more
format_list_bulleted
Related questions
Concept explainers
Question
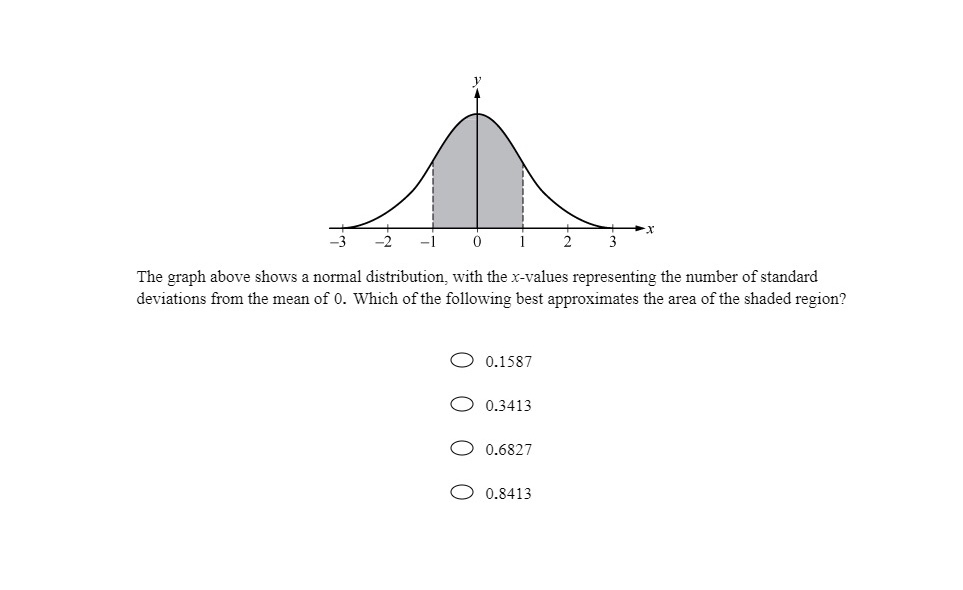

Transcribed Image Text:The graph above shows a normal distribution, with the x-values representing the number of standard
deviations from the mean of 0. Which of the following best approximates the area of the shaded region?
0.1587
0.3413
0.6827
0.8413
Expert Solution
This question has been solved!
Explore an expertly crafted, step-by-step solution for a thorough understanding of key concepts.

Step by stepSolved in 2 steps with 1 images

Knowledge Booster


Learn more about
Need a deep-dive on the concept behind this application? Look no further. Learn more about this topic, statistics and related others by exploring similar questions and additional content below.Similar questions
- Hayley has 120 apple trees of a certain variety in her orchard. She estimates the population of apples has a mean of 9 seeds per apple with a standard deviation of 2 seeds. The distribution in the number of seeds per apple has a shape that is approximately normal. The table gives the standard normal distribution. What percent of Hayley's apples have between 5 and 11 seeds? Enter your answer in the box rounded to the tenths place.arrow_forwardFind the area of the shaded region. The graph to the right depicts IQ scores of adults, and those scores are normally distributed with a mean of 100 and a standard deviation of 15. 108 124 The area of the shaded region is (Round to four decimal places as needed.)arrow_forward12arrow_forward
- Find the area of the shaded region. The graph to the right depicts IQ scores of adults, and those scores are normally distributed with a mean of 100 and a standard deviation of 15. Click to view page 1 of th - × The area of the shaded r Standard Normal Table (Page 1) NEGATIVE z Scores Standard Normal (z) Distribution: Cumulative Area from the LEFT .00 .01 02 .03 .04 .05 .06 .07 .08 .09 -3.50 and lower .0001 -3.4 .0003 .0003 .0003 .0003 .0003 .0003 -3.3 .0005 .0005 .0005 .0004 .0004 .0004 .0003 0004 .0003 .0004 .0003 .0004 .0002 .0003 -3.2 .0007 .0007 .0006 0006 .0006 .0006 .0006 .0005 .0005 .0005 -3.1 .0010 .0009 .0009 .0009 .0008 .0008 .0008 .0008 0007 .0007 -3.0 .0013 .0013 0013 .0012 0012 .0011 .0011 .0011 0010 0010 -2.9 .0019 0018 0018 .0017 .0016 .0016 .0015 .0015 .0014 .0014 -2.8 .0026 .0025 .0024 .0023 .0023 .0022 .0021 .0021 .0020 .0019 -2.7 .0035 .0034 .0033 .0032 .0031 .0030 .0029 .0028 .0027 .0026 -2.6 .0047 .0045 0044 .0043 .0041 .0040 .0039 .0038 .0037 .0036 -2.5 .0062…arrow_forwardBelow is a graph of a normal distribution with mean u = -3 and standard deviation o =2. The shaded region represents theprobability of obtaining a value from this distribution that is between -4 and 0. Shade the corresponding region under the standard normal curve below.arrow_forward
arrow_back_ios
arrow_forward_ios
Recommended textbooks for you
- MATLAB: An Introduction with ApplicationsStatisticsISBN:9781119256830Author:Amos GilatPublisher:John Wiley & Sons Inc
 Probability and Statistics for Engineering and th...StatisticsISBN:9781305251809Author:Jay L. DevorePublisher:Cengage Learning
 Statistics for The Behavioral Sciences (MindTap C...StatisticsISBN:9781305504912Author:Frederick J Gravetter, Larry B. WallnauPublisher:Cengage Learning
  Elementary Statistics: Picturing the World (7th E...StatisticsISBN:9780134683416Author:Ron Larson, Betsy FarberPublisher:PEARSON
 The Basic Practice of StatisticsStatisticsISBN:9781319042578Author:David S. Moore, William I. Notz, Michael A. FlignerPublisher:W. H. Freeman
 Introduction to the Practice of StatisticsStatisticsISBN:9781319013387Author:David S. Moore, George P. McCabe, Bruce A. CraigPublisher:W. H. Freeman
MATLAB: An Introduction with Applications
Statistics
ISBN:9781119256830
Author:Amos Gilat
Publisher:John Wiley & Sons Inc
Probability and Statistics for Engineering and th...
Statistics
ISBN:9781305251809
Author:Jay L. Devore
Publisher:Cengage Learning
Statistics for The Behavioral Sciences (MindTap C...
Statistics
ISBN:9781305504912
Author:Frederick J Gravetter, Larry B. Wallnau
Publisher:Cengage Learning
Elementary Statistics: Picturing the World (7th E...
Statistics
ISBN:9780134683416
Author:Ron Larson, Betsy Farber
Publisher:PEARSON
The Basic Practice of Statistics
Statistics
ISBN:9781319042578
Author:David S. Moore, William I. Notz, Michael A. Fligner
Publisher:W. H. Freeman
Introduction to the Practice of Statistics
Statistics
ISBN:9781319013387
Author:David S. Moore, George P. McCabe, Bruce A. Craig
Publisher:W. H. Freeman