
MATLAB: An Introduction with Applications
6th Edition
ISBN: 9781119256830
Author: Amos Gilat
Publisher: John Wiley & Sons Inc
expand_more
expand_more
format_list_bulleted
Related questions
Question
22

Transcribed Image Text:**Table Completion Exercise**
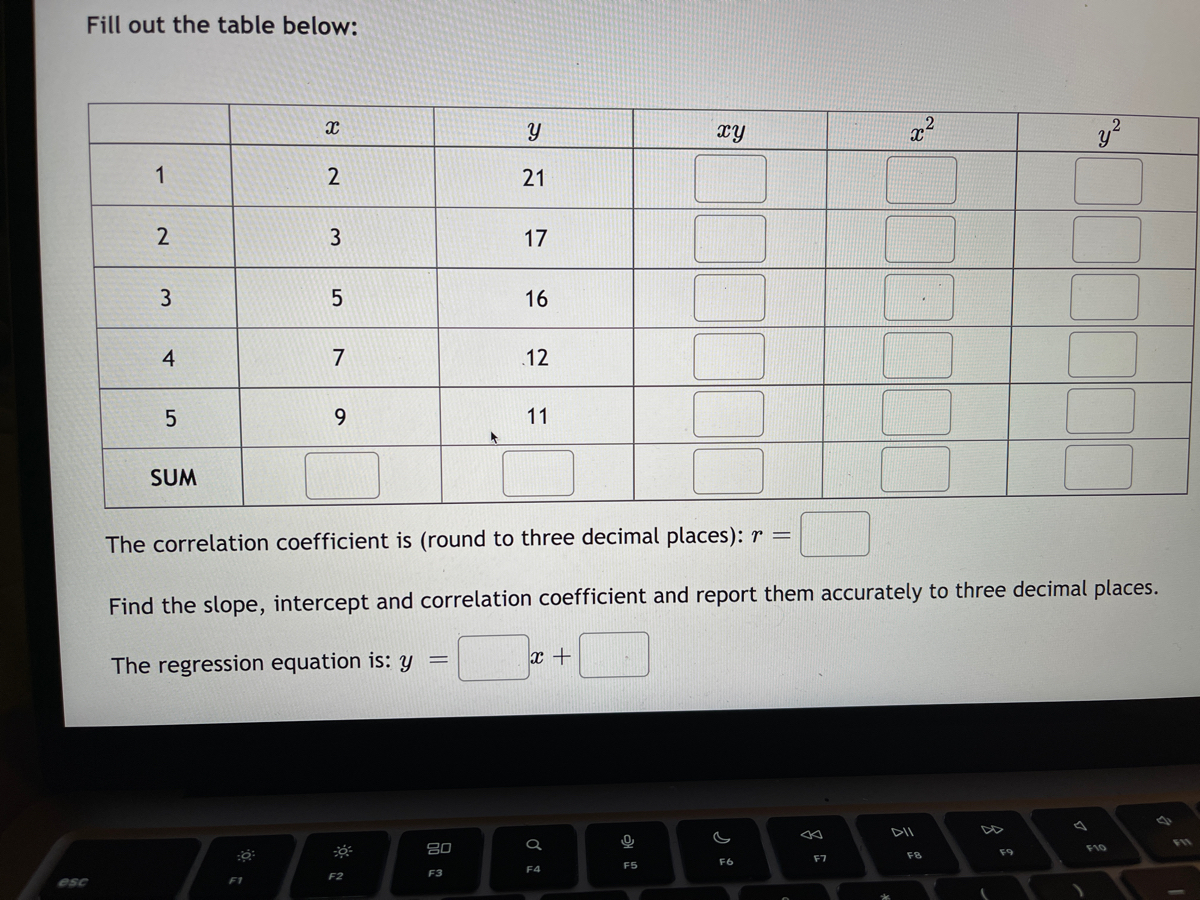
Fill out the table below:
| | \( x \) | \( y \) | \( xy \) | \( x^2 \) | \( y^2 \) |
|---|-------|-------|--------|--------|--------|
| 1 | 2 | 21 | | | |
| 2 | 3 | 17 | | | |
| 3 | 5 | 16 | | | |
| 4 | 7 | 12 | | | |
| 5 | 9 | 11 | | | |
| SUM | | | | | |
**Instructions:**
- Calculate the product \( xy \), square of \( x \) (\( x^2 \)), and square of \( y \) (\( y^2 \)) for each row.
- Find the sum of columns for \( x \), \( y \), \( xy \), \( x^2 \), and \( y^2 \) at the bottom of the table.
**Correlation and Regression:**
1. The correlation coefficient is (round to three decimal places): \( r = \_\_\_\_ \)
2. Find the slope, intercept, and correlation coefficient, and report them accurately to three decimal places.
3. The regression equation is: \( y = \_\_\_\_ x + \_\_\_\_ \)
**Notes:**
- Use the provided data to complete the calculations necessary to find the correlation coefficient, slope, and intercept.
- Understanding regression and correlation is crucial for interpreting relationships between variables.
Expert Solution
arrow_forward
Step 1
Given that
| X | Y |
| 2 | 21 |
| 3 | 17 |
| 5 | 16 |
| 7 | 12 |
| 9 | 11 |

Step by stepSolved in 3 steps with 1 images

Knowledge Booster

Similar questions
arrow_back_ios
arrow_forward_ios
Recommended textbooks for you
- MATLAB: An Introduction with ApplicationsStatisticsISBN:9781119256830Author:Amos GilatPublisher:John Wiley & Sons Inc
 Probability and Statistics for Engineering and th...StatisticsISBN:9781305251809Author:Jay L. DevorePublisher:Cengage Learning
 Statistics for The Behavioral Sciences (MindTap C...StatisticsISBN:9781305504912Author:Frederick J Gravetter, Larry B. WallnauPublisher:Cengage Learning
  Elementary Statistics: Picturing the World (7th E...StatisticsISBN:9780134683416Author:Ron Larson, Betsy FarberPublisher:PEARSON
 The Basic Practice of StatisticsStatisticsISBN:9781319042578Author:David S. Moore, William I. Notz, Michael A. FlignerPublisher:W. H. Freeman
 Introduction to the Practice of StatisticsStatisticsISBN:9781319013387Author:David S. Moore, George P. McCabe, Bruce A. CraigPublisher:W. H. Freeman
MATLAB: An Introduction with Applications
Statistics
ISBN:9781119256830
Author:Amos Gilat
Publisher:John Wiley & Sons Inc
Probability and Statistics for Engineering and th...
Statistics
ISBN:9781305251809
Author:Jay L. Devore
Publisher:Cengage Learning
Statistics for The Behavioral Sciences (MindTap C...
Statistics
ISBN:9781305504912
Author:Frederick J Gravetter, Larry B. Wallnau
Publisher:Cengage Learning
Elementary Statistics: Picturing the World (7th E...
Statistics
ISBN:9780134683416
Author:Ron Larson, Betsy Farber
Publisher:PEARSON
The Basic Practice of Statistics
Statistics
ISBN:9781319042578
Author:David S. Moore, William I. Notz, Michael A. Fligner
Publisher:W. H. Freeman
Introduction to the Practice of Statistics
Statistics
ISBN:9781319013387
Author:David S. Moore, George P. McCabe, Bruce A. Craig
Publisher:W. H. Freeman