MATLAB: An Introduction with Applications
6th Edition
ISBN: 9781119256830
Author: Amos Gilat
Publisher: John Wiley & Sons Inc
expand_more
expand_more
format_list_bulleted
Concept explainers
Question
I need help on Letter D.) and E.)
Im trying to find the
D.) Predict y value if x=3 assuming the linear correlation is significant.
E.) Predict y value if x=3 assuming the linear correlation is not significant.

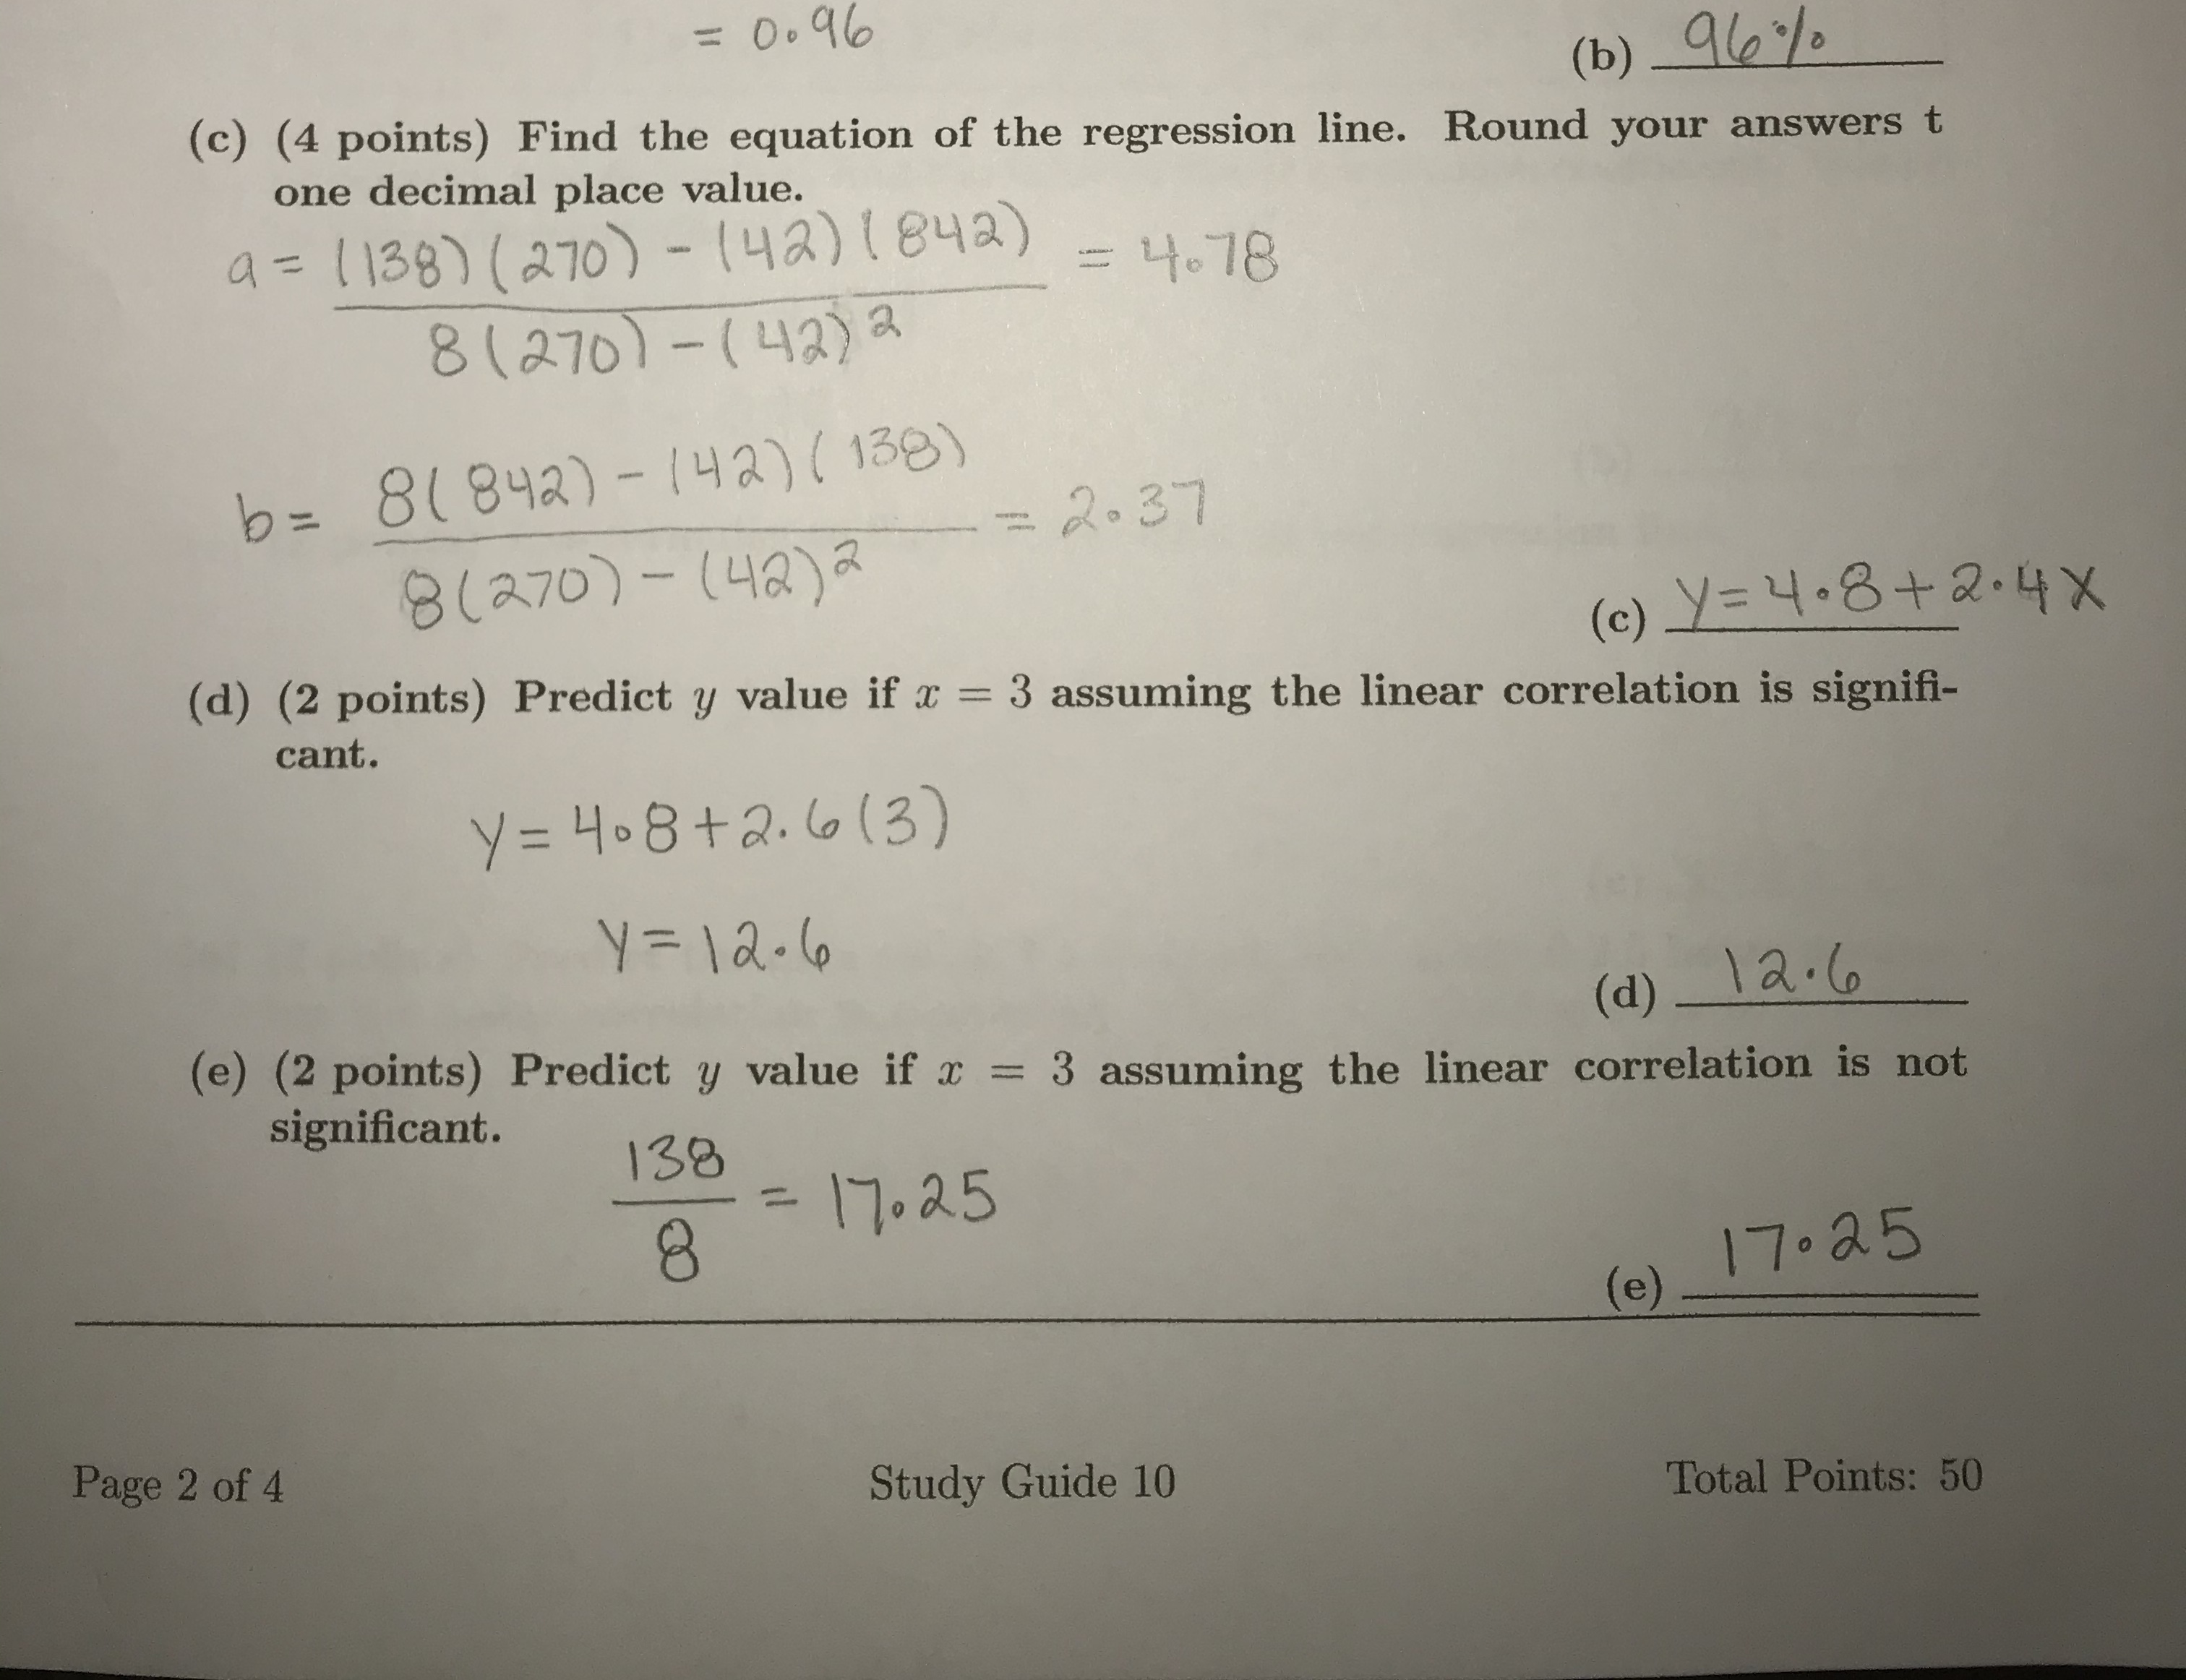
Transcribed Image Text:= 0.96
(b) 96%
(c) (4 points) Find the equation of the regression line. Round your answers t
one decimal place value.
a=1138) (270) - (42)1842)
8(270)-(42) a
나78
b= 8(842)- (42)138)
8(270)-(42)a
2.37
(e) Y=4•8+2.4X
(d) (2 points) Predict y value if x = 3 assuming the linear correlation is signifi-
%3D
cant.
y = 408+2.6(3)
Y= 12.6
(d) _2.6
(e) (2 points) Predict y value if x = 3 assuming the linear correlation is not
significant.
138
=17.25
8.
17.25
(e)
Page 2 of 4
Study Guide 10
Total Points: 50

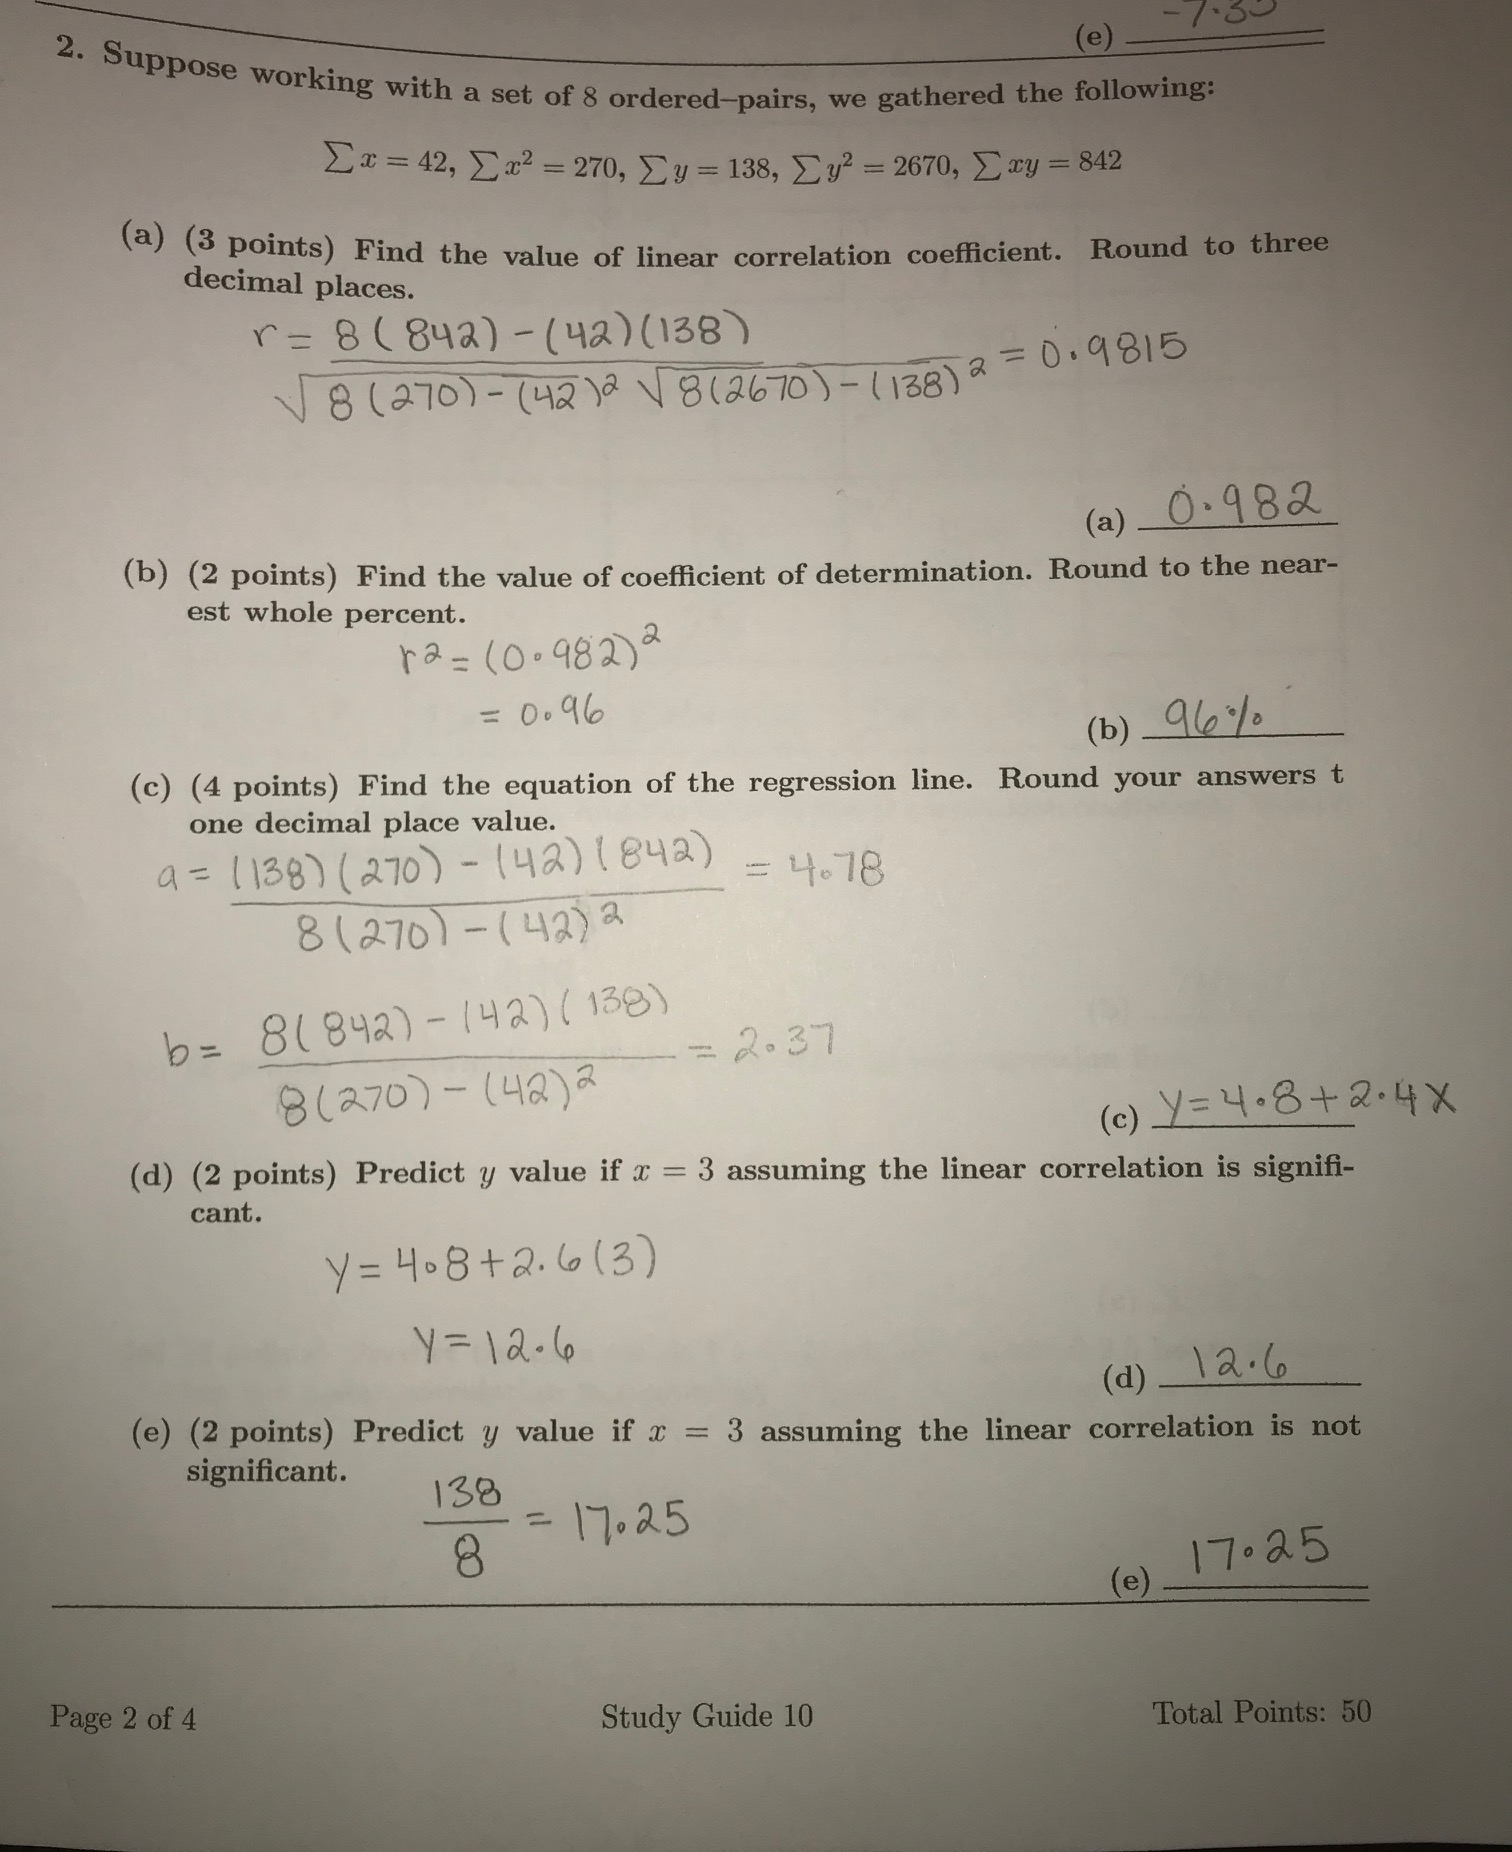
Transcribed Image Text:(e)
2. Suppose working with a set of 8 ordered-pairs, we gathered the following:
Σ- 42, Σε?-270, Σy = 138 , Σ' = 270, Σεy-842
a) (3 points) Find the value of linear correlation coefficient. Round to three
decimal places.
r= 8(842)- (42)(138)
V8(270)-(42ja v8(2670)-138) 2 =0.4815
%3D
(a) 0.982
(b) (2 points) Find the value of coefficient of determination. Round to the near-
est whole percent.
ra=(0.982)2
= 0.96
(b) 96%
(c) (4 points) Find the equation of the regression line. Round your answers t
one decimal place value.
a= 1138) (270)-(42)1842)
8(270)-(42)a
4.78
b= 8(842) -142)(138)
8(270)-(42)2
= 2.37
(c) Y=4.8+2·4X
(d) (2 points) Predict y value if x = 3 assuming the linear correlation is signifi-
%3D
cant.
Y = 408+2. 6(3)
Y= 12-6
(d) _ \2.6
(e) (2 points) Predict y value if x = 3 assuming the linear correlation is not
significant.
138
= 17.25
8.
%3D
17.25
(e)
Page 2 of 4
Study Guide 10
Total Points: 50
Expert Solution
This question has been solved!
Explore an expertly crafted, step-by-step solution for a thorough understanding of key concepts.
This is a popular solution
Trending nowThis is a popular solution!
Step by stepSolved in 6 steps with 6 images

Knowledge Booster
Learn more about
Need a deep-dive on the concept behind this application? Look no further. Learn more about this topic, statistics and related others by exploring similar questions and additional content below.Similar questions
- I need help on my classworkarrow_forwardA scatterplot is made of the average height (x axis) and average blood temperature (y axis) of 200 different mammals. The correlation is medially positive, approximately around r = 0.6. Human is at the 2 SD below the average on height and approximately 1.2 SD below the average on blood temperature. This implies this point is... Group of answer choices No answer text provided. on the SD line it is impossible to say with the information given on the regression linearrow_forwardThe amygdala is a brain structure involved in the processing and memory of emotional reactions. In a research project, 10 subjects were shown emotional video clips. They then had their brain scanned with positron emission tomography (PET) and their memory of the clips was assessed quantitatively. Here are the relative amygdala activity and the memory score for each subject: The relationship is (Linear or curved) and ( Moderate, weak, or strong)? The direction of the realtionship is (Negitive or positive)? The amygdala and memory 3/4: The correlation coefficient between relative activity and memory score is: (round your answer to 3 decimal places)arrow_forward
- The following statement contains an error. Choose the statement that best explains the error. "The correlation between shoe size and height is 0.87 inches" A. Correlation requires that both of the variables be categorical B. When stating the correlation coefficient, one must state whether it is a positive or negative relationship C. This statement does not tell us whether or not shoe size is correlated with height D. When reporting correlation, one does not report units because correlation has no units E. There is no error in this statementarrow_forward3. The speed (in miles per hour) of 8 vehicles and their braking distance (in feet) when stopping on a dry surface speed, x braking distance, y 20 30 40 50 50 60 65 70 55 72 75 110 138 162 193 225 type of correlation: Conclusionarrow_forwardUse the data in the table, which shows the average annual salaries (both in thousands of dollars) for public school principals and teachers in the U.S. for 11 years. Apply what you have learned in the previous tab to complete this graded lab questions. 1. Repeat the steps from tab #1 using this data to construct a scatter plot graph and calculate the correlation coefficient R. (Recall the corelation coefficient is R and not R Teachers y Principalsx 77.8 43.7 78.4 43.8 80.8 45.0 R= 80.5 45.6, 2. Does the R value represent a positive, negative or no correlation between the salaries ol the teachers and principals? As teacher salaries increase, what happens to prinicipal salaries? 10 11 81.5 45.9 84.8 48.2 12 13 87.7 49,3 3. Write the equation of the regression line for the data below. The equation is y= 14 91.6 51.3 52.9 Teachers y 15 16 95.7 54.4 COD 54.2 =D0.5873x-2.0s07o R=0.995, 17 95.7 4. Use the regression equation that you found in exercise #3 to predict the average annual salary…arrow_forward
- What kind of relationship is depicted in the following graph? 7 2 1 0 2 3 a. A positive linear correlation b. A nonlinear correlation c. No correlation Od. A negative linear correlation 6 9 10arrow_forwardLet x be the average number of employees in a group health insurance plan, and let y be the average administrative cost as a percentage of claims. (b) Would you say the correlation is low, moderate, or strong? positive or negative? a) moderate and positiveb) low and negative c) strong and positived) strong and negativee) low and positivef) moderate and negative As x increases, does the value of r imply that y should tend to increase or decrease? Explain. a) Given our value of r, y should tend to decrease as x increases.b) Given our value of r, y should tend to remain constant as x increases. c) Given our value of r, y should tend to increase as x increases.d) Given our value of r, we cannot draw any conclusions for the behavior of y as x increases.arrow_forwardWhich of the following denotes the slope or the regression coefficient for X? A) The term a B) The term b C) The error term D) The correlation coefficient, rarrow_forward
- the number of rubber bands used and the distance, incentimeters, of her jump. When they created a scatterplotthe relationship appeared to be linear, and the correlationwas r = 0.996. After discussing these results, the teacherinstructed the students to convert the distances to inches.What effect will this have on the correlation between thetwo variables?a) Because 1 cm = 0.393701 inches, the correlationwill become .392126.b) Because 1 cm = 0.393701 inches, the correlationwill become 2.5298.c) Because only the length measurements have changed,the correlation will decrease substantially.d) Because changing from centimeters to inches doesnot affect the value of the correlation, the correlationwill remain 0.996. e) Because inches is a much more common measure-ment for distance in the United States, the relation-ship between the data will be stronger and thus the correlation will increase.arrow_forwardfind t reject or fail to rejectarrow_forwardPlease help me with this questionarrow_forward
arrow_back_ios
arrow_forward_ios
Recommended textbooks for you
 MATLAB: An Introduction with ApplicationsStatisticsISBN:9781119256830Author:Amos GilatPublisher:John Wiley & Sons Inc
 Probability and Statistics for Engineering and th...StatisticsISBN:9781305251809Author:Jay L. DevorePublisher:Cengage Learning
 Statistics for The Behavioral Sciences (MindTap C...StatisticsISBN:9781305504912Author:Frederick J Gravetter, Larry B. WallnauPublisher:Cengage Learning
 Elementary Statistics: Picturing the World (7th E...StatisticsISBN:9780134683416Author:Ron Larson, Betsy FarberPublisher:PEARSON
 The Basic Practice of StatisticsStatisticsISBN:9781319042578Author:David S. Moore, William I. Notz, Michael A. FlignerPublisher:W. H. Freeman
 Introduction to the Practice of StatisticsStatisticsISBN:9781319013387Author:David S. Moore, George P. McCabe, Bruce A. CraigPublisher:W. H. Freeman

MATLAB: An Introduction with Applications
Statistics
ISBN:9781119256830
Author:Amos Gilat
Publisher:John Wiley & Sons Inc

Probability and Statistics for Engineering and th...
Statistics
ISBN:9781305251809
Author:Jay L. Devore
Publisher:Cengage Learning

Statistics for The Behavioral Sciences (MindTap C...
Statistics
ISBN:9781305504912
Author:Frederick J Gravetter, Larry B. Wallnau
Publisher:Cengage Learning

Elementary Statistics: Picturing the World (7th E...
Statistics
ISBN:9780134683416
Author:Ron Larson, Betsy Farber
Publisher:PEARSON

The Basic Practice of Statistics
Statistics
ISBN:9781319042578
Author:David S. Moore, William I. Notz, Michael A. Fligner
Publisher:W. H. Freeman

Introduction to the Practice of Statistics
Statistics
ISBN:9781319013387
Author:David S. Moore, George P. McCabe, Bruce A. Craig
Publisher:W. H. Freeman