
MATLAB: An Introduction with Applications
6th Edition
ISBN: 9781119256830
Author: Amos Gilat
Publisher: John Wiley & Sons Inc
expand_more
expand_more
format_list_bulleted
Related questions
Question
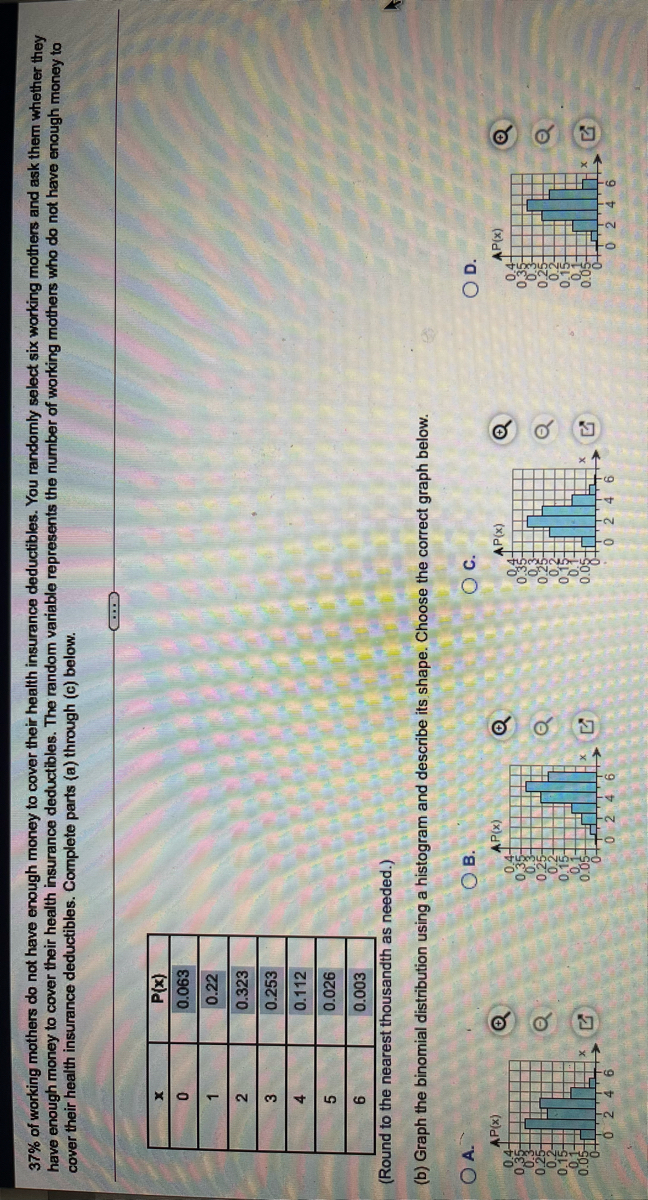

Transcribed Image Text:37% of working mothers do not have enough money to cover their health insurance deductibles. You randomly select six working mothers and ask them whether they
have enough money to cover their health insurance deductibles. The random variable represents the number of working mothers who do not have enough money to
cover their health insurance deductibles. Complete parts (a) through (c) below.
(x)d
0.063
0.22
2
0.323
0.253
3.
0.112
0.026
5.
0.003
9.
(Round to the nearest thousandth as needed.)
(b) Graph the binomial distribution using a histogram and describe its shape. Choose the correct graph below.
O B.
Oc.
OD.
0.4+
(x)dv
(x)d
(x)dV
(x)d
of
0 2 46
2 4
0 246
Expert Solution
This question has been solved!
Explore an expertly crafted, step-by-step solution for a thorough understanding of key concepts.

This is a popular solution

Trending nowThis is a popular solution!

Step by stepSolved in 2 steps with 2 images

Knowledge Booster

Similar questions
- Fifty-one (51) statistics students were asked how much sleep they get per school night (rounded to the nearest hour). The results are as shown in the following frequency distribution table. Find the median. State your result/answer as a value with exactly one digit after the decimal. Values Frequency CumulativeFrequency 4 2 2 5 5 7 6 7 14 7 11 25 10 16 41 11 6 47 12 4 51arrow_forwardDescribe the sampling distribution of p. Round to three decimal places when necessary. N=22,000, n=400, p=0.3arrow_forwardFind the margin of error for the given values of c, s, and n. c= 0.98, s = 4, n = 28 Click the icon to view the t-distribution table. The margin of error is (Round to one decimal place as needed.)arrow_forward
- der Describe the shape of the distribution. OA. The distribution is uniform. O B. The distribution is skewed to the right. OC. The distribution is skewed to the left. OD. The distribution is bell shaped.arrow_forwardUse binomial table and graph for n = 5, p = 0.96 to answer the following: What is the shape of the binomial distribution when p = 0.96?arrow_forwardThe box plotarrow_forward
- Find the mean of the binomial distribution for which n=60 and p=0.2. Round the answer to the nearest hundredth, as needed. Question content area bottom Part 1 A.30.00 30.00 B. 60.00 C.3.10 3.10 D.12.00arrow_forwardCheckout times. The checkout times (in minutes) for 12 randomly selected customers at a large supermarket during the store's busiest time are: 5.8 6.1 11.5 11.1 11.1 13.5 6.2 7.7 7.1 12.3 13.6 13.7 a. Find the mean of the checkout times. mins (Type an integer or a decimal. Round to two decimal places.) b. Find the standard deviation of the checkout times. mins (Type an integer or a decimal. Round to two decimal places.) ncer Due A ent As DAY DECarrow_forwardPlz help asap 5.arrow_forward
arrow_back_ios
arrow_forward_ios
Recommended textbooks for you
- MATLAB: An Introduction with ApplicationsStatisticsISBN:9781119256830Author:Amos GilatPublisher:John Wiley & Sons Inc
 Probability and Statistics for Engineering and th...StatisticsISBN:9781305251809Author:Jay L. DevorePublisher:Cengage Learning
 Statistics for The Behavioral Sciences (MindTap C...StatisticsISBN:9781305504912Author:Frederick J Gravetter, Larry B. WallnauPublisher:Cengage Learning
  Elementary Statistics: Picturing the World (7th E...StatisticsISBN:9780134683416Author:Ron Larson, Betsy FarberPublisher:PEARSON
 The Basic Practice of StatisticsStatisticsISBN:9781319042578Author:David S. Moore, William I. Notz, Michael A. FlignerPublisher:W. H. Freeman
 Introduction to the Practice of StatisticsStatisticsISBN:9781319013387Author:David S. Moore, George P. McCabe, Bruce A. CraigPublisher:W. H. Freeman
MATLAB: An Introduction with Applications
Statistics
ISBN:9781119256830
Author:Amos Gilat
Publisher:John Wiley & Sons Inc
Probability and Statistics for Engineering and th...
Statistics
ISBN:9781305251809
Author:Jay L. Devore
Publisher:Cengage Learning
Statistics for The Behavioral Sciences (MindTap C...
Statistics
ISBN:9781305504912
Author:Frederick J Gravetter, Larry B. Wallnau
Publisher:Cengage Learning
Elementary Statistics: Picturing the World (7th E...
Statistics
ISBN:9780134683416
Author:Ron Larson, Betsy Farber
Publisher:PEARSON
The Basic Practice of Statistics
Statistics
ISBN:9781319042578
Author:David S. Moore, William I. Notz, Michael A. Fligner
Publisher:W. H. Freeman
Introduction to the Practice of Statistics
Statistics
ISBN:9781319013387
Author:David S. Moore, George P. McCabe, Bruce A. Craig
Publisher:W. H. Freeman