
Advanced Engineering Mathematics
10th Edition
ISBN: 9780470458365
Author: Erwin Kreyszig
Publisher: Wiley, John & Sons, Incorporated
expand_more
expand_more
format_list_bulleted
Related questions
Question

Transcribed Image Text:**Educational Content on Derivatives and Graph Analysis**
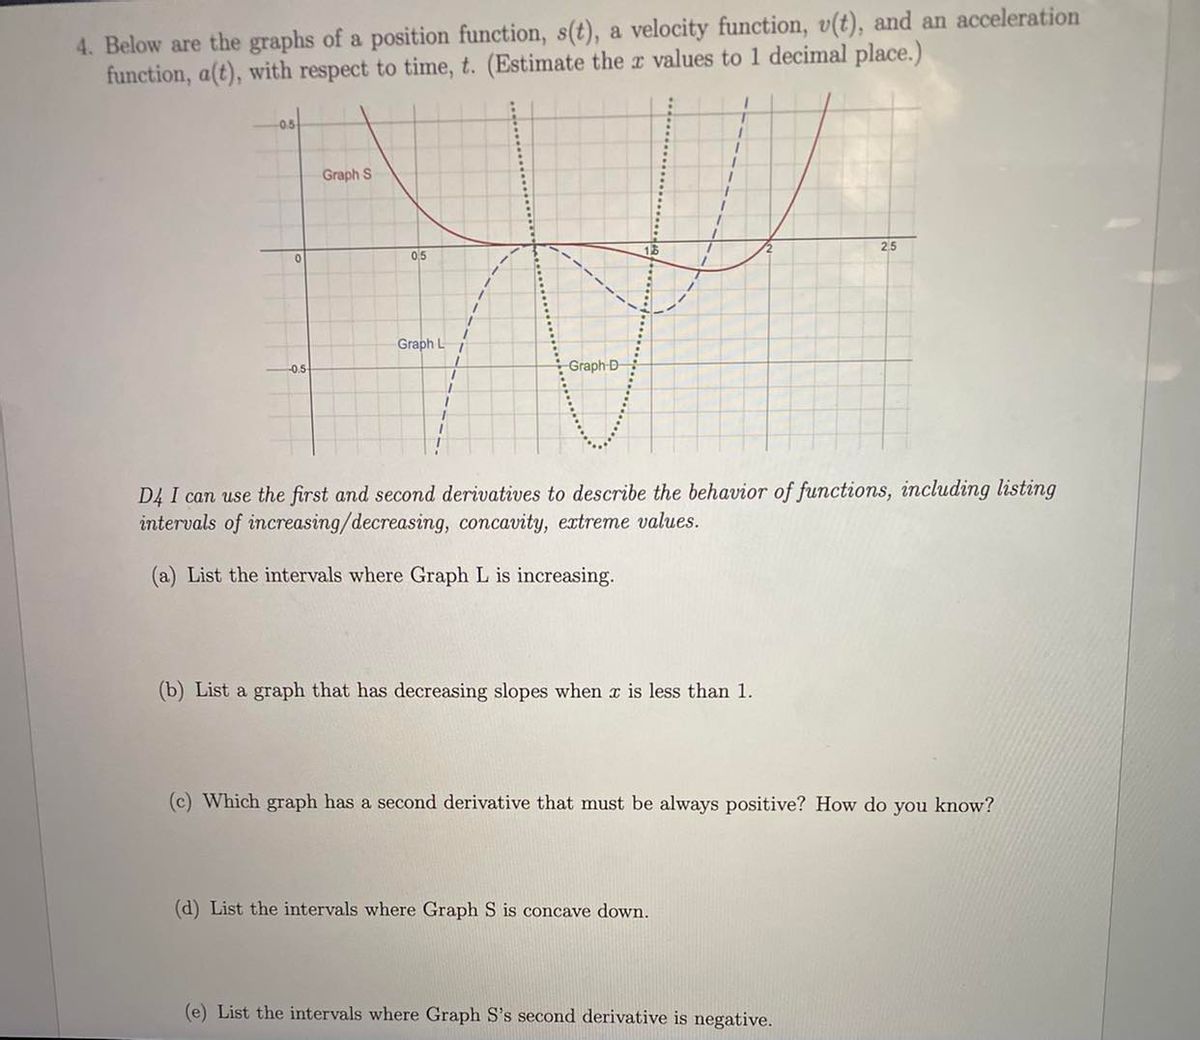
**Understanding Graphs: Position, Velocity, and Acceleration**
The image presents three graphs representing a position function, \( s(t) \), a velocity function, \( v(t) \), and an acceleration function, \( a(t) \), each as a function of time, \( t \). You are required to estimate the \( x \) values to 1 decimal place.
**Graph Descriptions**:
- **Graph S**: Red curve
- **Graph L**: Blue curve
- **Graph D**: Dotted curve
**Tasks and Questions**:
(a) **Intervals where Graph L is increasing**:
To determine these intervals, observe where the slope of Graph L is positive.
(b) **Graph with decreasing slopes for \( x < 1 \)**:
Identify the graph where the slope becomes less positive or more negative as \( x \) decreases below 1.
(c) **Graph with always positive second derivative**:
A positive second derivative indicates that the graph is concave up. Determine which graph maintains this property across its entire domain.
(d) **Intervals where Graph S is concave down**:
A graph is concave down when its second derivative is negative. Identify the segments of Graph S where this condition holds.
(e) **Intervals where Graph S's second derivative is negative**:
This is a similar analysis to part (d), focusing on the negativity of the second derivative specifically for Graph S.
By carefully analyzing these graphs, one can leverage first and second derivatives to describe functional behaviors, such as intervals of increase/decrease, concavity, and extreme values.
Expert Solution
arrow_forward
Step 1: Part a
Observe the graph L increased upto x=1, then decreased up to x=1.5 and thereafter again increases.
Therefore, the graph L increases format('truetype')%3Bfont-weight%3Anormal%3Bfont-style%3Anormal%3B%7D%40font-face%7Bfont-family%3A'round_brackets18549f92a457f2409'%3Bsrc%3Aurl(data%3Afont%2Ftruetype%3Bcharset%3Dutf-8%3Bbase64%2CAAEAAAAMAIAAAwBAT1MvMjwHLFQAAADMAAAATmNtYXDf7xCrAAABHAAAADxjdnQgBAkDLgAAAVgAAAASZ2x5ZmAOz2cAAAFsAAABJGhlYWQOKih8AAACkAAAADZoaGVhCvgVwgAAAsgAAAAkaG10eCA6AAIAAALsAAAADGxvY2EAAARLAAAC%2BAAAABBtYXhwBIgEWQAAAwgAAAAgbmFtZXHR30MAAAMoAAACOXBvc3QDogHPAAAFZAAAACBwcmVwupWEAAAABYQAAAAHAAAGcgGQAAUAAAgACAAAAAAACAAIAAAAAAAAAQIAAAAAAAAAAAAAAAAAAAAAAAAAAAAAAAAAAAAAACAgICAAAAAo8AMGe%2F57AAAHPgGyAAAAAAACAAEAAQAAABQAAwABAAAAFAAEACgAAAAGAAQAAQACACgAKf%2F%2FAAAAKAAp%2F%2F%2F%2F2f%2FZAAEAAAAAAAAAAAFUAFYBAAAsAKgDgAAyAAcAAAACAAAAKgDVA1UAAwAHAAA1MxEjEyMRM9XVq4CAKgMr%2FQAC1QABAAD%2B0AIgBtAACQBNGAGwChCwA9SwAxCwAtSwChCwBdSwBRCwANSwAxCwBzywAhCwCDwAsAoQsAPUsAMQsAfUsAoQsAXUsAoQsADUsAMQsAI8sAcQsAg8MTAREAEzABEQASMAAZCQ%2FnABkJD%2BcALQ%2FZD%2BcAGQAnACcAGQ%2FnAAAQAA%2FtACIAbQAAkATRgBsAoQsAPUsAMQsALUsAoQsAXUsAUQsADUsAMQsAc8sAIQsAg8ALAKELAD1LADELAH1LAKELAF1LAKELAA1LADELACPLAHELAIPDEwARABIwAREAEzAAIg%2FnCQAZD%2BcJABkALQ%2FZD%2BcAGQAnACcAGQ%2FnAAAQAAAAEAAPW2NYFfDzz1AAMIAP%2F%2F%2F%2F%2FVre7u%2F%2F%2F%2F%2F9Wt7u4AAP7QA7cG0AAAAAoAAgABAAAAAAABAAAHPv5OAAAXcAAA%2F%2F4DtwABAAAAAAAAAAAAAAAAAAAAAwDVAAACIAAAAiAAAAAAAAAAAAAkAAAAowAAASQAAQAAAAMACgACAAAAAAACAIAEAAAAAAAEAABNAAAAAAAAABUBAgAAAAAAAAABAD4AAAAAAAAAAAACAA4APgAAAAAAAAADAFwATAAAAAAAAAAEAD4AqAAAAAAAAAAFABYA5gAAAAAAAAAGAB8A%2FAAAAAAAAAAIABwBGwABAAAAAAABAD4AAAABAAAAAAACAA4APgABAAAAAAADAFwATAABAAAAAAAEAD4AqAABAAAAAAAFABYA5gABAAAAAAAGAB8A%2FAABAAAAAAAIABwBGwADAAEECQABAD4AAAADAAEECQACAA4APgADAAEECQADAFwATAADAAEECQAEAD4AqAADAAEECQAFABYA5gADAAEECQAGAB8A%2FAADAAEECQAIABwBGwBSAG8AdQBuAGQAIABiAHIAYQBjAGsAZQB0AHMAIAB3AGkAdABoACAAYQBzAGMAZQBuAHQAIAAxADgANQA0AFIAZQBnAHUAbABhAHIATQBhAHQAaABzACAARgBvAHIAIABNAG8AcgBlACAAUgBvAHUAbgBkACAAYgByAGEAYwBrAGUAdABzACAAdwBpAHQAaAAgAGEAcwBjAGUAbgB0ACAAMQA4ADUANABSAG8AdQBuAGQAIABiAHIAYQBjAGsAZQB0AHMAIAB3AGkAdABoACAAYQBzAGMAZQBuAHQAIAAxADgANQA0AFYAZQByAHMAaQBvAG4AIAAyAC4AMFJvdW5kX2JyYWNrZXRzX3dpdGhfYXNjZW50XzE4NTQATQBhAHQAaABzACAARgBvAHIAIABNAG8AcgBlAAAAAAMAAAAAAAADnwHPAAAAAAAAAAAAAAAAAAAAAAAAAAC5B%2F8AAY2FAA%3D%3D)format('truetype')%3Bfont-weight%3Anormal%3Bfont-style%3Anormal%3B%7D%3C%2Fstyle%3E%3C%2Fdefs%3E%3Ctext%20font-family%3D%22round_brackets18549f92a457f2409%22%20font-size%3D%2216%22%20text-anchor%3D%22middle%22%20x%3D%223.5%22%20y%3D%2216%22%3E(%3C%2Ftext%3E%3Ctext%20font-family%3D%22round_brackets18549f92a457f2409%22%20font-size%3D%2216%22%20text-anchor%3D%22middle%22%20x%3D%2253.5%22%20y%3D%2216%22%3E)%3C%2Ftext%3E%3Ctext%20font-family%3D%22math1a35ba88cbffd64c3f681a2ae73%22%20font-size%3D%2216%22%20text-anchor%3D%22middle%22%20x%3D%2211.5%22%20y%3D%2216%22%3E%26%23x2212%3B%3C%2Ftext%3E%3Ctext%20font-family%3D%22math1a35ba88cbffd64c3f681a2ae73%22%20font-size%3D%2216%22%20text-anchor%3D%22middle%22%20x%3D%2227.5%22%20y%3D%2216%22%3E%26%23x221E%3B%3C%2Ftext%3E%3Ctext%20font-family%3D%22math1a35ba88cbffd64c3f681a2ae73%22%20font-size%3D%2216%22%20text-anchor%3D%22middle%22%20x%3D%2239.5%22%20y%3D%2216%22%3E%2C%3C%2Ftext%3E%3Ctext%20font-family%3D%22Arial%22%20font-size%3D%2216%22%20text-anchor%3D%22middle%22%20x%3D%2246.5%22%20y%3D%2216%22%3E1%3C%2Ftext%3E%3Ctext%20font-family%3D%22math1a35ba88cbffd64c3f681a2ae73%22%20font-size%3D%2216%22%20text-anchor%3D%22middle%22%20x%3D%2263.5%22%20y%3D%2216%22%3E%26%23x222A%3B%3C%2Ftext%3E%3Ctext%20font-family%3D%22round_brackets18549f92a457f2409%22%20font-size%3D%2216%22%20text-anchor%3D%22middle%22%20x%3D%2274.5%22%20y%3D%2216%22%3E(%3C%2Ftext%3E%3Ctext%20font-family%3D%22round_brackets18549f92a457f2409%22%20font-size%3D%2216%22%20text-anchor%3D%22middle%22%20x%3D%22111.5%22%20y%3D%2216%22%3E)%3C%2Ftext%3E%3Ctext%20font-family%3D%22Arial%22%20font-size%3D%2216%22%20text-anchor%3D%22middle%22%20x%3D%2280.5%22%20y%3D%2216%22%3E1%3C%2Ftext%3E%3Ctext%20font-family%3D%22math1a35ba88cbffd64c3f681a2ae73%22%20font-size%3D%2216%22%20text-anchor%3D%22middle%22%20x%3D%2287.5%22%20y%3D%2216%22%3E%2C%3C%2Ftext%3E%3Ctext%20font-family%3D%22math1a35ba88cbffd64c3f681a2ae73%22%20font-size%3D%2216%22%20text-anchor%3D%22middle%22%20x%3D%2299.5%22%20y%3D%2216%22%3E%26%23x221E%3B%3C%2Ftext%3E%3C%2Fsvg%3E) .
.

Step by stepSolved in 6 steps with 1 images

Knowledge Booster

Similar questions
- ri File Edit View History Bookmarks Window Help く > F9 F1 F2 F5 F6 F8 4, 3. 2. 3.arrow_forward(5) General (Algebra 2 - a Quiz: 2020 Semester 1 Midte A Desmos | Graphing Calcula instructure.com ues/3018506/auizzes/735342/take Consider the graph of f (2) below. (-3, 16) | 15 54 (-7,0) (1.0) -10 -5 5. 10 This function can be written in the form f (x) = Aa + Bx ! C. Find the values of A, B, and C. Note: Your answers should be integers. A = B = C =arrow_forward
arrow_back_ios
arrow_forward_ios
Recommended textbooks for you
- Advanced Engineering MathematicsAdvanced MathISBN:9780470458365Author:Erwin KreyszigPublisher:Wiley, John & Sons, Incorporated
 Numerical Methods for EngineersAdvanced MathISBN:9780073397924Author:Steven C. Chapra Dr., Raymond P. CanalePublisher:McGraw-Hill Education
 Introductory Mathematics for Engineering Applicat...Advanced MathISBN:9781118141809Author:Nathan KlingbeilPublisher:WILEY
  Mathematics For Machine TechnologyAdvanced MathISBN:9781337798310Author:Peterson, John.Publisher:Cengage Learning,

Advanced Engineering Mathematics
Advanced Math
ISBN:9780470458365
Author:Erwin Kreyszig
Publisher:Wiley, John & Sons, Incorporated
Numerical Methods for Engineers
Advanced Math
ISBN:9780073397924
Author:Steven C. Chapra Dr., Raymond P. Canale
Publisher:McGraw-Hill Education
Introductory Mathematics for Engineering Applicat...
Advanced Math
ISBN:9781118141809
Author:Nathan Klingbeil
Publisher:WILEY
Mathematics For Machine Technology
Advanced Math
ISBN:9781337798310
Author:Peterson, John.
Publisher:Cengage Learning,