
MATLAB: An Introduction with Applications
6th Edition
ISBN: 9781119256830
Author: Amos Gilat
Publisher: John Wiley & Sons Inc
expand_more
expand_more
format_list_bulleted
Related questions
Question
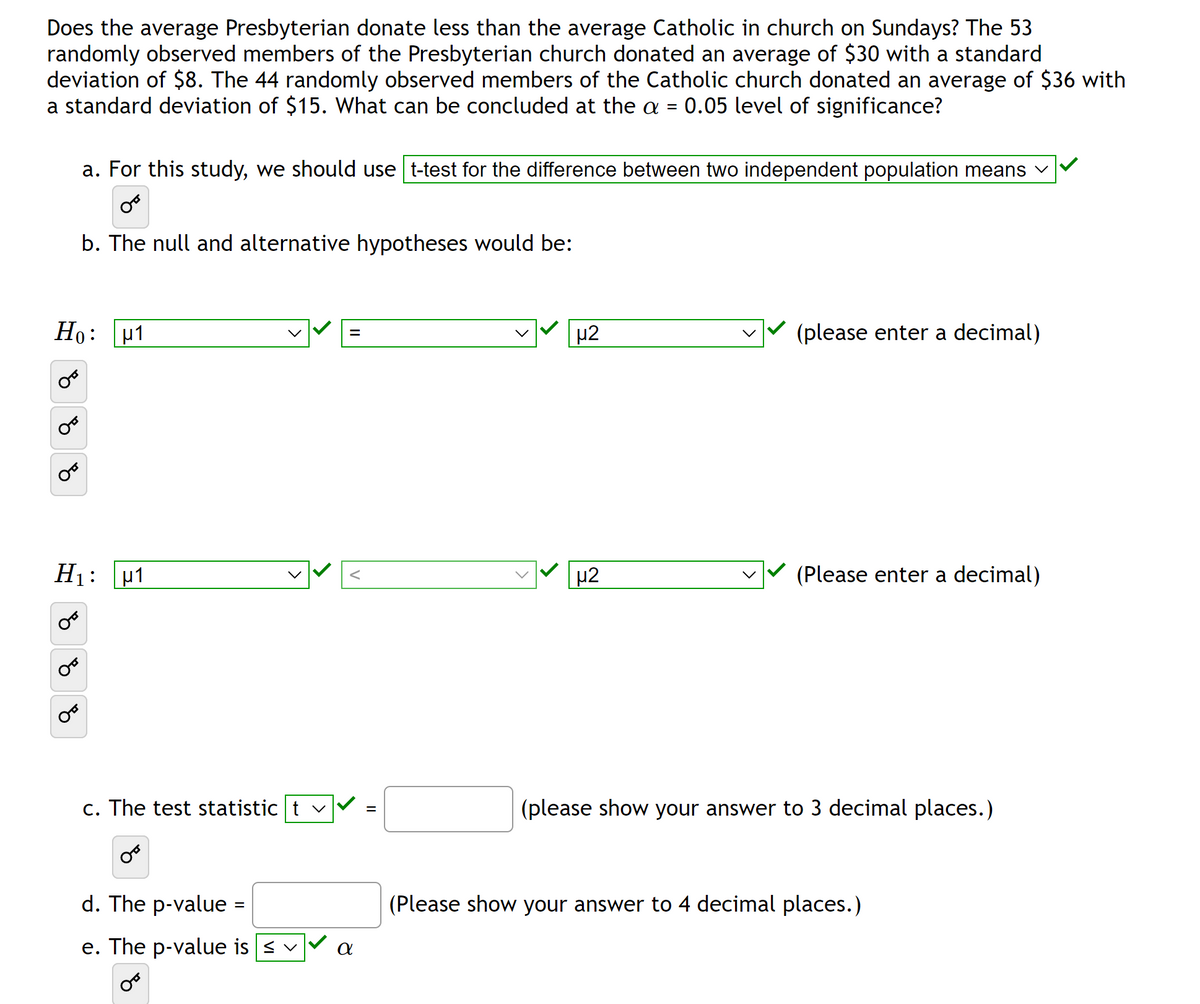

Transcribed Image Text:Does the average Presbyterian donate less than the average Catholic in church on Sundays? The 53
randomly observed members of the Presbyterian church donated an average of $30 with a standard
deviation of $8. The 44 randomly observed members of the Catholic church donated an average of $36 with
a standard deviation of $15. What can be concluded at the a = 0.05 level of significance?
Ho:
४
8
a. For this study, we should use t-test for the difference between two independent population means ✓
OF
b. The null and alternative hypotheses would be:
H₁:
४
H1
μ1
c. The test statistic tv
d. The p-value =
e. The p-value is ≤ ✓
OB
=
α
=
µ2
μ2
(please enter a decimal)
(Please enter a decimal)
(please show your answer to 3 decimal places.)
(Please show your answer to 4 decimal places.)
Expert Solution
This question has been solved!
Explore an expertly crafted, step-by-step solution for a thorough understanding of key concepts.

Step by stepSolved in 3 steps with 2 images

Knowledge Booster

Similar questions
- Which of the following are required to use the t test (remember there is both the variable you are testing and the grouping variable)? a. An Interval variable b. A Dichotomous variable c. Neither a nor b d. Both a and barrow_forwardCan a low barometer reading be used to predict maximum wind speed of an approaching tropical cydone? For a random sample of tropical cyclones, let x be the lowest pressure (in millibars) as a cyclone approaches, and let y be the maximum wind speed (in miles per hour) of the cyclone. x 1004 975 992 935 971 924 y 40 100 65 145 78 147 A USE SALT (a) Make a scatter diagram ofr the data and visualize the line you think best fits the data. * 140 1000 140 1000 120- 120 100 100 80 80 940 60 940 E 60 40 40e. 920li 40 920 40 60 80 100 120 140 940 960 980 1000 60 80 100 120 140 940 960 980 1000 x (lowest pressure (in millibars) x (lowest pressure (in millibars) x (lowest pressure (in millibars)) x (lowest pressure (in millibars) (b) Would you say the correlation is low, moderate, or strong? O low O moderate O strong Would you say the correlation is positive or negative? O positive O negative (C) Use a calculator to verity thatx - 5801, - 5,613,547, E- 575, E- 64,543 and xy - 549,281. Compute r.…arrow_forwardanswer question D based on the given informaarrow_forward
- Please solve for G, H, and Iarrow_forwardA score with a value ________ the mean will have a z-score that is less than or equal to zero. a. Less than b. Greater than c. Equal to d. A & Carrow_forwardQ19 determine whether the given value is a statistic or a parameter. A homeowner measured the voltage supplied to his home on all 7 days of a given week, and the average ( mean ) value is 126.3 volts. choose the correct answer below . A. The given value is a parameter for the week because the data collected respresent a population. b. The given value is a parameter for the week because the data collected represent a sample. c. The given value is a statistic for the week because the data collected represent a population. d. The given value is a statistic for the week because the data collected represent a sample.arrow_forward
- Need help with #30arrow_forwardThis data describes the flight of a plastic glider launched from a tower on a hilltop. The height values are negative whenever the glider was below the height of the hilltop. Find the lowest point in the gliders path. TIME (s) HEIGHT (m) 0 9 1 5.5 2 2.5 3 0 4 -2 5 -3.5 6 -4.5 7 -5 8 -5 9 -4.5 10 -3.5 11 -2 12 0 13 2.5 14 5.5 15 9 16 13 17 17.5 18 22.5 19 28 20 34arrow_forwardWhich of the following can be assessed by a dependent T-Test? Group of answer choices the score means of two distinct group the score means of pre and post tests from same participants the score means of three distinct grouparrow_forward
- Ho at the 0.02 level of significance? Do you reject or fail to reject and H,: u=25, H,:4#25 P = 0.028 25, H: u +25 Given O Not sufficient information to decide Ho Reject reject H 4. Fail to rejectarrow_forwardk $ Let p be the population proportion for the following condition. Find the point estimates for p and q. Of 974 children surveyed, 123 plan to join the armed forces in the future. The point estimate for p, p, is (Round to three decimal places as needed.) U (Round to three decimal places as needed.) The point estimate for q, q, is J V ○ 발 C F5 30 % 5 T F6 6 ✈ Y H FZ C & N B N. JU F8 * 00 8 ... A F9 M 09 9 K F10 70°F Sunny ☀- F11 O P + 1:17 PM ^ D G E¹ (1) 11/28/2022 F12 E V Next PrtSc + 11 Insarrow_forward100) The absolute value the calculated t value for a paired t-test. The critical value you would use if doing a two-tailed test. The critical value you would use if doing a one-tailed test. The result of a two-tailed test. The result of a one-tailed test.arrow_forward
arrow_back_ios
arrow_forward_ios
Recommended textbooks for you
- MATLAB: An Introduction with ApplicationsStatisticsISBN:9781119256830Author:Amos GilatPublisher:John Wiley & Sons Inc
 Probability and Statistics for Engineering and th...StatisticsISBN:9781305251809Author:Jay L. DevorePublisher:Cengage Learning
 Statistics for The Behavioral Sciences (MindTap C...StatisticsISBN:9781305504912Author:Frederick J Gravetter, Larry B. WallnauPublisher:Cengage Learning
  Elementary Statistics: Picturing the World (7th E...StatisticsISBN:9780134683416Author:Ron Larson, Betsy FarberPublisher:PEARSON
 The Basic Practice of StatisticsStatisticsISBN:9781319042578Author:David S. Moore, William I. Notz, Michael A. FlignerPublisher:W. H. Freeman
 Introduction to the Practice of StatisticsStatisticsISBN:9781319013387Author:David S. Moore, George P. McCabe, Bruce A. CraigPublisher:W. H. Freeman
MATLAB: An Introduction with Applications
Statistics
ISBN:9781119256830
Author:Amos Gilat
Publisher:John Wiley & Sons Inc
Probability and Statistics for Engineering and th...
Statistics
ISBN:9781305251809
Author:Jay L. Devore
Publisher:Cengage Learning
Statistics for The Behavioral Sciences (MindTap C...
Statistics
ISBN:9781305504912
Author:Frederick J Gravetter, Larry B. Wallnau
Publisher:Cengage Learning
Elementary Statistics: Picturing the World (7th E...
Statistics
ISBN:9780134683416
Author:Ron Larson, Betsy Farber
Publisher:PEARSON
The Basic Practice of Statistics
Statistics
ISBN:9781319042578
Author:David S. Moore, William I. Notz, Michael A. Fligner
Publisher:W. H. Freeman
Introduction to the Practice of Statistics
Statistics
ISBN:9781319013387
Author:David S. Moore, George P. McCabe, Bruce A. Craig
Publisher:W. H. Freeman