
MATLAB: An Introduction with Applications
6th Edition
ISBN: 9781119256830
Author: Amos Gilat
Publisher: John Wiley & Sons Inc
expand_more
expand_more
format_list_bulleted
Related questions
Question
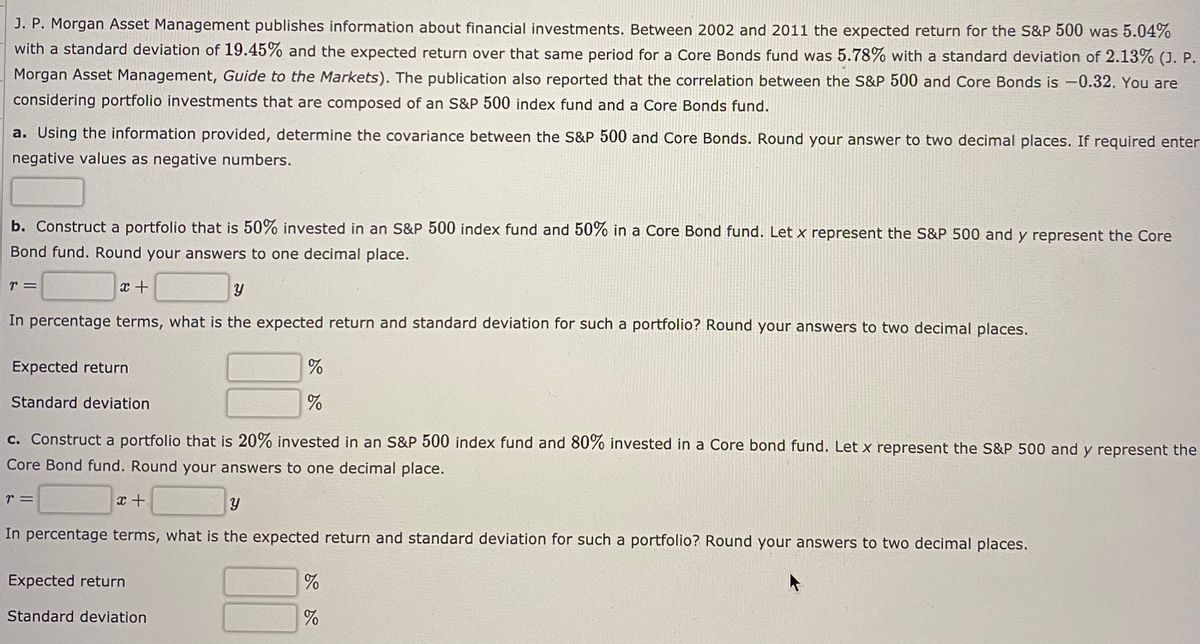

Transcribed Image Text:J. P. Morgan Asset Management publishes information about financial investments. Between 2002 and 2011 the expected return for the S&P 500 was 5.04%
with a standard deviation of 19.45% and the expected return over that same period for a Core Bonds fund was 5.78% with a standard deviation of 2.13% (J. P.
Morgan Asset Management, Guide to the Markets). The publication also reported that the correlation between the S&P 500 and Core Bonds is -0.32. You are
considering portfolio investments that are composed of an S&P 500 index fund and a Core Bonds fund.
a. Using the information provided, determine the covariance between the S&P 500 and Core Bonds. Round your answer to two decimal places. If required enter
negative values as negative numbers.
b. Construct a portfolio that is 50% invested in an S&P 500 index fund and 50% in a Core Bond fund. Let x represent the S&P 500 and y represent the Core
Bond fund. Round your answers to one decimal place.
r 3=
In percentage terms, what is the expected return and standard deviation for such a portfolio? Round your answers to two decimal places.
Expected return
%
Standard deviation
c. Construct a portfolio that is 20% invested in an S&P 500 index fund and 80% invested in a Core bond fund. Let x represent the S&P 500 and y represent the
Core Bond fund. Round your answers to one decimal place.
r =
In percentage terms, what is the expected return and standard deviation for such a portfolio? Round your answers to two decimal places.
Expected return
Standard deviation
%
Expert Solution
This question has been solved!
Explore an expertly crafted, step-by-step solution for a thorough understanding of key concepts.

This is a popular solution

Trending nowThis is a popular solution!

Step by stepSolved in 3 steps with 3 images

Knowledge Booster

Similar questions
- A study of Brown Bag Company's payment practices showed that the company pays its vendors 20 days after the accounting department receives the invoice. The standard deviation is 5 days. Assuming that there is a normal distribution across the company's payments, what percent of the invoices are paid within 15 days of receiving them? Based on your answer, recommend an effective payment strategy for the company.arrow_forwardRisk taking is an important part of investing. In order to make suitable investment decisions on behalf of their customers, portfolio managers give a questionnaire to new customers to measure their desire to take financial risks. The scores on the questionnaire are approximately normally distributed with a mean of 51 and a standard deviation of 15 . The customers with scores in the bottom 10% are described as "risk averse." What is the questionnaire score that separates customers who are considered risk averse from those who are not? Carry your intermediate computations to at least four decimal places. Round your answer to one decimal place.arrow_forwardRisk taking is an important part of investing. In order to make suitable investment decisions on behalf of their customers, portfolio managers give a questionnaire to new customers to measure their desire to take financial risks. The scores on the questionnaire are approximately normally distributed with a mean of 50 and a standard deviation of 14. The customers with scores in the bottom 15% are described as "risk averse." What is the questionnaire score that separates customers who are considered risk averse from those who are not? Carry your intermediate computations to at least four decimal places. Round your answer to one decimal place.arrow_forward
- At the end of 2015, 2016, and 2017, the average prices of a share of stock in a portfolio were $34.83, $34.65, and $31.26 respectively. To investigate the average share price at the end of 2018, a random sample of 30 stocks was drawn and their closing prices on the last trading day of 2018 were observed with a mean of 33.583 and a standard deviation of 19.149. Estimate the average price of a share of stock in the portfolio at the end of 2018 with a 95% confidence interval. Compare and Briefly discussarrow_forwardThe inflation adjusted annual return of a diversified asset portfolio is assumed to have a normal distribution with a mean of 3.5% and a standard deviation of 1.25%. Represent the value for the inflation adjusted annual return that 95% of outcomes would exceed on a diagram and determine this value.arrow_forwardConsider a population of 1024 mutual funds that primarily invest in large companies. You have determined that u, the mean one-year total percentage return achieved by all the funds, is 9.80 and that o, the standard deviation, is 0.50. Complete (a) through (c). a. According to the empirical rule, what percentage of these funds is expected to be within +2 standard deviations of the mean? 95 % b. According to the Chebyshev rule, what percentage of these funds are expected to be within +2 standard deviations of the mean? 75 % (Round to two decimal places as needed.) c. According to the Chebyshev rule, at least 88.89% of these funds are expected to have one-year total returns between what two amounts? Between and (Round to two decimal places as needed.)arrow_forward
- A certain brokerage house wants to estimate the mean daily return on a certain stock. A random sample of 19 days yields the following return percentages. 0.28, 1.92, -1.2, 2.78, 1.97,-0.57, 1.46, -0.93, 0.58,-1.41, -1.15, 0.01, -1.49, −0.94, 1.73, 2.07, -0.83, 1.44, -2.28 Send data to calculator If we assume that the returns are normally distributed, find a 90% confidence interval for the mean daily return on this stock. Give the lower limit and upper limit of the 90% confidence interval. Carry your intermediate computations to at least three decimal places. Round your answers to one decimal place. (If necessary, consult a list of formulas.) Lower limit: 0 Upper limit: 0 Xarrow_forwardA doctor is using a growth chart for baby girls that indicates a 12-month-old baby girl has a mean weight of 21.1 pounds with a standard deviation of about 2.29 pounds. Assume that the weights are approximately normally distributed. What proportion of 12-month-old baby girls weigh between 19.62 and 22.17 pounds?arrow_forwardRisk taking is an important part of investing. In order to make suitable investment decisions on behalf of their customers, portfolio managers give a questionnaire to new customers to measure their desire to take financial risks. The scores on the questionnaire are approximately normally distributed with a mean of 49 and a standard deviation of 16 . The customers with scores in the bottom 15% are described as "risk averse." What is the questionnaire score that separates customers who are considered risk averse from those who are not? Carry your intermediate computations to at least four decimal places. Round your answer to one decimal place.arrow_forward
arrow_back_ios
arrow_forward_ios
Recommended textbooks for you
- MATLAB: An Introduction with ApplicationsStatisticsISBN:9781119256830Author:Amos GilatPublisher:John Wiley & Sons Inc
 Probability and Statistics for Engineering and th...StatisticsISBN:9781305251809Author:Jay L. DevorePublisher:Cengage Learning
 Statistics for The Behavioral Sciences (MindTap C...StatisticsISBN:9781305504912Author:Frederick J Gravetter, Larry B. WallnauPublisher:Cengage Learning
  Elementary Statistics: Picturing the World (7th E...StatisticsISBN:9780134683416Author:Ron Larson, Betsy FarberPublisher:PEARSON
 The Basic Practice of StatisticsStatisticsISBN:9781319042578Author:David S. Moore, William I. Notz, Michael A. FlignerPublisher:W. H. Freeman
 Introduction to the Practice of StatisticsStatisticsISBN:9781319013387Author:David S. Moore, George P. McCabe, Bruce A. CraigPublisher:W. H. Freeman
MATLAB: An Introduction with Applications
Statistics
ISBN:9781119256830
Author:Amos Gilat
Publisher:John Wiley & Sons Inc
Probability and Statistics for Engineering and th...
Statistics
ISBN:9781305251809
Author:Jay L. Devore
Publisher:Cengage Learning
Statistics for The Behavioral Sciences (MindTap C...
Statistics
ISBN:9781305504912
Author:Frederick J Gravetter, Larry B. Wallnau
Publisher:Cengage Learning
Elementary Statistics: Picturing the World (7th E...
Statistics
ISBN:9780134683416
Author:Ron Larson, Betsy Farber
Publisher:PEARSON
The Basic Practice of Statistics
Statistics
ISBN:9781319042578
Author:David S. Moore, William I. Notz, Michael A. Fligner
Publisher:W. H. Freeman
Introduction to the Practice of Statistics
Statistics
ISBN:9781319013387
Author:David S. Moore, George P. McCabe, Bruce A. Craig
Publisher:W. H. Freeman