
MATLAB: An Introduction with Applications
6th Edition
ISBN: 9781119256830
Author: Amos Gilat
Publisher: John Wiley & Sons Inc
expand_more
expand_more
format_list_bulleted
Related questions
Question
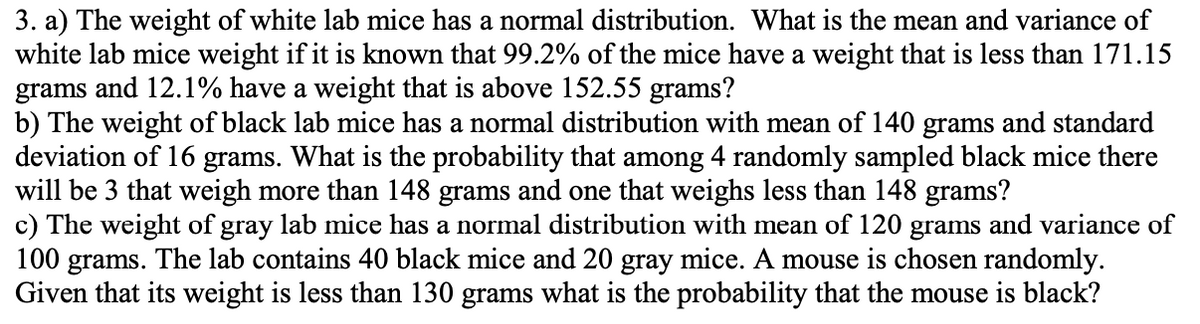

Transcribed Image Text:3. a) The weight of white lab mice has a normal distribution. What is the mean and variance of
white lab mice weight if it is known that 99.2% of the mice have a weight that is less than 171.15
grams and 12.1% have a weight that is above 152.55 grams?
b) The weight of black lab mice has a normal distribution with mean of 140 grams and standard
deviation of 16 grams. What is the probability that among 4 randomly sampled black mice there
will be 3 that weigh more than 148 grams and one that weighs less than 148 grams?
c) The weight of gray lab mice has a normal distribution with mean of 120 grams and variance of
100 grams. The lab contains 40 black mice and 20 gray mice. A mouse is chosen randomly.
Given that its weight is less than 130 grams what is the probability that the mouse is black?
Expert Solution
This question has been solved!
Explore an expertly crafted, step-by-step solution for a thorough understanding of key concepts.

This is a popular solution

Trending nowThis is a popular solution!

Step by stepSolved in 3 steps

Knowledge Booster

Similar questions
- The owner of a fast-food restaurant knows that, on average, 2.4 cars (customers) use the drive-through window between 3 pm and 3.15 pm. Find the variance and standard deviation Find the probability that exactly two cars will use the drive-through window Find the probability that at least three cars will use the drive-through windowarrow_forward18. Among female in city between 18 and 74 years of age, diastolic blood pressure is normally distributed with mean u=77 mmHg and standard deviation=11.6 mmHg.a. what is the probability that a randomly selected woman has a diastolic blood pressure less than 60 mmHg?b. What is the probability that she has a diastolic blood pressure greater than 90 mmHg?c. What is the probability that the woman has a diastolic blood pressure between 60 and 90 mmHg?arrow_forward6) Assume that the heights of men are normally distributed with a mean of 68.0 inches and a standard deviation of 3.5 inches. If 100 men are randomly selected, find the probability that they have a mean height greater than 69 inches.arrow_forward
- An urn contains 7 black and 18 white balls. A ball is randomly drawn from the urn. Let X = 1 if a white ball is drawn and let X = -1 if a black ball is drawn. Find the following a) mean of X b) variance of X Please provide your working and round your answers to 2 decimal placesarrow_forward9. Women's heights are normally distributed with a mean of 63.8 in and standard deviation of 2.6 in. a) If one woman is randomly selected, find the probability that her height is less than 62.4 inches. b) If one woman is randomly selected, find the probability that her height is more than 64.5 inches. c) If one woman is randomly selected, find the probability that her height is between 61.0 inches and 68.0 inches. d) If 24 women are randomly selected, find the probability their mean height is less than 62.1 inches. e) Find P17.arrow_forwardThe grade appeal process at a university requires that a jury be structured by selecting eight individuals randomly from a pool of eleven students and nine faculty. (a) What is the probability of selecting a jury of all students? (b) What is the probability of selecting a jury of all faculty? (c) What is the probability of selecting a jury of three students and five faculty?arrow_forward
- Suppose the weight of turkeys in a store are normally distributed with mean 15.5 lb and standard deviation 2 lb. If a turkey is grabbed at random what is the probability that the weight will be less than 16 lb?arrow_forwardAn engineer is going to redesign an ejection seat for an airplane. The seat was designed for pilots weighing between 130 lb and 181 lb. The new population of pilots has normally distributed weights with a mean of 137 lb and a standard deviation of 34.8 lb. if 35 different pilot are randomly selected find the probability that their mean weight is between 130 lb and 181 lbarrow_forwardThe weights of all the turkeys sold in Fairfax County in 2020 were recorded in the data set “Fairfax Turkey Weights” found in the histogram. The weights are presented in pounds. There are 235,428 turkeys in this population. Calculate the probability that, in a random sample of eight turkeys, the mean weight is between 17 and 20 pounds. First, draw a picture with the rounded mean and values labeled and the shaded area representing the desired probability. Next, take a picture of your hand drawn sketch and upload it (if you do not have this technology, you may use any other method (i.e. Microsoft paint) to sketch the image). Then, complete this part by standardizing and using the Standard Normal Table to obtain this probability. Show your work “by hand”.arrow_forward
- 6. Frackly Oil is sold in 900 milliliter (ml) cans. The mean volume of oil placed in a can is 880 ml with a standard deviation of 7.8 ml. Assuming a normal distribution of the data, what is the probability that the filling machine will cause an overflow in a can, that is, the probability that more than 900 ml will be placed in the can?arrow_forwardIf I roll two six-sided dice, what is the mean and variance of their difference? (note, the difference of 3 and 1 is 3 - 1 = 2, but the difference of 1 and 3 is 1-3 = -2) a) What is the mean? (express as an integer or reduced fraction) Reduce your answer to lowest terms. b) What is the variance? (express as an integer or reduced fraction) Reduce your answer to lowest terms. Submit partarrow_forward
arrow_back_ios
arrow_forward_ios
Recommended textbooks for you
- MATLAB: An Introduction with ApplicationsStatisticsISBN:9781119256830Author:Amos GilatPublisher:John Wiley & Sons Inc
 Probability and Statistics for Engineering and th...StatisticsISBN:9781305251809Author:Jay L. DevorePublisher:Cengage Learning
 Statistics for The Behavioral Sciences (MindTap C...StatisticsISBN:9781305504912Author:Frederick J Gravetter, Larry B. WallnauPublisher:Cengage Learning
  Elementary Statistics: Picturing the World (7th E...StatisticsISBN:9780134683416Author:Ron Larson, Betsy FarberPublisher:PEARSON
 The Basic Practice of StatisticsStatisticsISBN:9781319042578Author:David S. Moore, William I. Notz, Michael A. FlignerPublisher:W. H. Freeman
 Introduction to the Practice of StatisticsStatisticsISBN:9781319013387Author:David S. Moore, George P. McCabe, Bruce A. CraigPublisher:W. H. Freeman
MATLAB: An Introduction with Applications
Statistics
ISBN:9781119256830
Author:Amos Gilat
Publisher:John Wiley & Sons Inc
Probability and Statistics for Engineering and th...
Statistics
ISBN:9781305251809
Author:Jay L. Devore
Publisher:Cengage Learning
Statistics for The Behavioral Sciences (MindTap C...
Statistics
ISBN:9781305504912
Author:Frederick J Gravetter, Larry B. Wallnau
Publisher:Cengage Learning
Elementary Statistics: Picturing the World (7th E...
Statistics
ISBN:9780134683416
Author:Ron Larson, Betsy Farber
Publisher:PEARSON
The Basic Practice of Statistics
Statistics
ISBN:9781319042578
Author:David S. Moore, William I. Notz, Michael A. Fligner
Publisher:W. H. Freeman
Introduction to the Practice of Statistics
Statistics
ISBN:9781319013387
Author:David S. Moore, George P. McCabe, Bruce A. Craig
Publisher:W. H. Freeman