
MATLAB: An Introduction with Applications
6th Edition
ISBN: 9781119256830
Author: Amos Gilat
Publisher: John Wiley & Sons Inc
expand_more
expand_more
format_list_bulleted
Related questions
Question
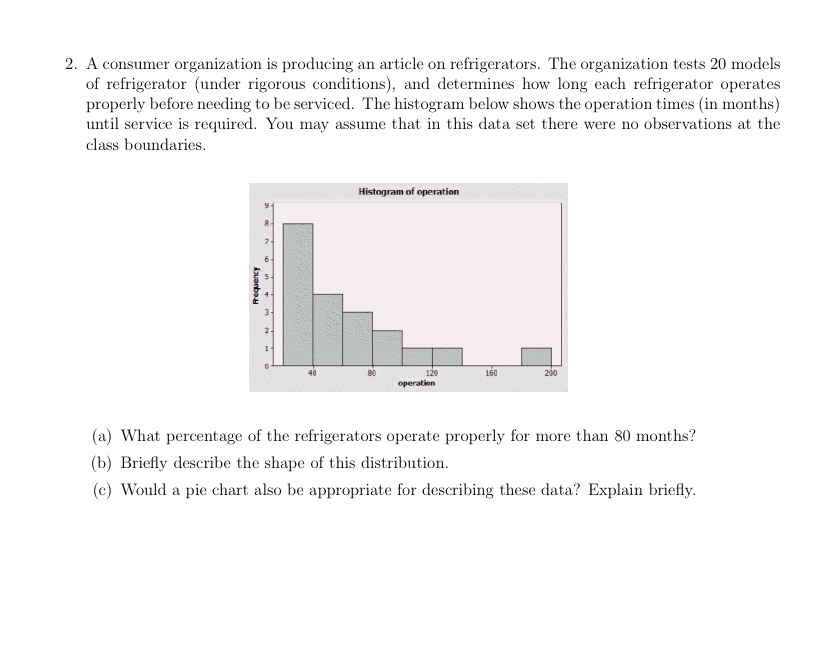

Transcribed Image Text:2. A consumer organization is producing an article on refrigerators. The organization tests 20 models
of refrigerator (under rigorous conditions), and determines how long each refrigerator operates
properly before needing to be serviced. The histogram below shows the operation times (in months)
until service is required. You may assume that in this data set there were no observations at the
class boundaries.
Histogram of operation
160
120
operation
80
200
(a) What percentage of the refrigerators operate properly for more than 80 months?
(b) Briefly describe the shape of this distribution.
(c) Would a pie chart also be appropriate for describing these data? Explain briefly.
on4 m
Asuorbo
Expert Solution
This question has been solved!
Explore an expertly crafted, step-by-step solution for a thorough understanding of key concepts.

Step by stepSolved in 4 steps with 1 images

Knowledge Booster

Similar questions
- I need help with only question 14. I need help with parts a,b,c,d, and e.arrow_forwardNeed help asap pls!arrow_forwardAn investigation of the properties of bricks used to line aluminum smelter pots was published in an article. Six different commercial bricks were evaluated. The life span of a smelter pot depends on the porosity of the brick lining (the less porosity, the longer the life span); consequently, the researchers measured the apparent porosity of each brick specimen, as well as the mean pore diameter of each brick. See the table. Apparent Porosity (y). Mean Pore Diameter (x). Click the icon to view the table. Data table Mean Pore Diameter Apparent Porosity (%) (micrometers) Brick Interpret the y-intercept of the line. Choose the correct answer below. 18.7 12.0 В 18.3 9.8 O A. The y-intercept is Bo- This value has no meaning because 0 is not in the observed range of the independent variable mean pore diameter. 16.3 7.3 6.9 5.4 O B. The y-intercept is Bo: For each unit increase in mean pore diameter, the mean porosity is estimated to increase by B0- 17.2 10.9 O C. There is not enough…arrow_forward
arrow_back_ios
arrow_forward_ios
Recommended textbooks for you
- MATLAB: An Introduction with ApplicationsStatisticsISBN:9781119256830Author:Amos GilatPublisher:John Wiley & Sons Inc
 Probability and Statistics for Engineering and th...StatisticsISBN:9781305251809Author:Jay L. DevorePublisher:Cengage Learning
 Statistics for The Behavioral Sciences (MindTap C...StatisticsISBN:9781305504912Author:Frederick J Gravetter, Larry B. WallnauPublisher:Cengage Learning
  Elementary Statistics: Picturing the World (7th E...StatisticsISBN:9780134683416Author:Ron Larson, Betsy FarberPublisher:PEARSON
 The Basic Practice of StatisticsStatisticsISBN:9781319042578Author:David S. Moore, William I. Notz, Michael A. FlignerPublisher:W. H. Freeman
 Introduction to the Practice of StatisticsStatisticsISBN:9781319013387Author:David S. Moore, George P. McCabe, Bruce A. CraigPublisher:W. H. Freeman
MATLAB: An Introduction with Applications
Statistics
ISBN:9781119256830
Author:Amos Gilat
Publisher:John Wiley & Sons Inc
Probability and Statistics for Engineering and th...
Statistics
ISBN:9781305251809
Author:Jay L. Devore
Publisher:Cengage Learning
Statistics for The Behavioral Sciences (MindTap C...
Statistics
ISBN:9781305504912
Author:Frederick J Gravetter, Larry B. Wallnau
Publisher:Cengage Learning
Elementary Statistics: Picturing the World (7th E...
Statistics
ISBN:9780134683416
Author:Ron Larson, Betsy Farber
Publisher:PEARSON
The Basic Practice of Statistics
Statistics
ISBN:9781319042578
Author:David S. Moore, William I. Notz, Michael A. Fligner
Publisher:W. H. Freeman
Introduction to the Practice of Statistics
Statistics
ISBN:9781319013387
Author:David S. Moore, George P. McCabe, Bruce A. Craig
Publisher:W. H. Freeman