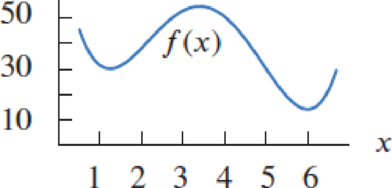
For Exercises 1–2 , indicate all critical points on the given graphs. Which correspond to local minima , local maxima , global maxima, global minima, or none of these? (Note that the graphs are on closed intervals.)
For Exercises 1–2 , indicate all critical points on the given graphs. Which correspond to local minima , local maxima , global maxima, global minima, or none of these? (Note that the graphs are on closed intervals.)
For Exercises 1–2, indicate all critical points on the given graphs. Which correspond to local minima, local maxima, global maxima, global minima, or none of these? (Note that the graphs are on closed intervals.)
Formula Formula A function f(x) attains a local maximum at x=a , if there exists a neighborhood (a−δ,a+δ) of a such that, f(x)<f(a), ∀ x∈(a−δ,a+δ),x≠a f(x)−f(a)<0, ∀ x∈(a−δ,a+δ),x≠a In such case, f(a) attains a local maximum value f(x) at x=a .
Expert Solution & Answer
To determine
To indicate: All critical points on the given graphs, which correspond to local maxima, local minima, global maxima, global minima or none of these.
Explanation of Solution
Definition used:
Local maxima and local minima:
Suppose p is a point in the domain of f(x):
1. f(x) has a local minimum at p if f(p) is less than or equal to the values of f(x) for points near p.
2. f(x) has a local maximum at p if f(p) is greater than or equal to the values of f(x) for points near p.
Global maxima and minima:
Suppose p is a point in the domain of f(x):
1. f(x) has a global minimum at p if f(p) is less than or equal to all values of f(x).
2. f(x) has a global maximum at p if f(p) is greater than or equal to all values of f(x).
Theorem used:
If f is continuous on the closed interval a≤x≤b, then f has a global maximum and a global minimum on that interval.
Calculation:
It is given that, the graph is on closed interval, by the above theorem the function will have global maximum and a global minimum on the interval.
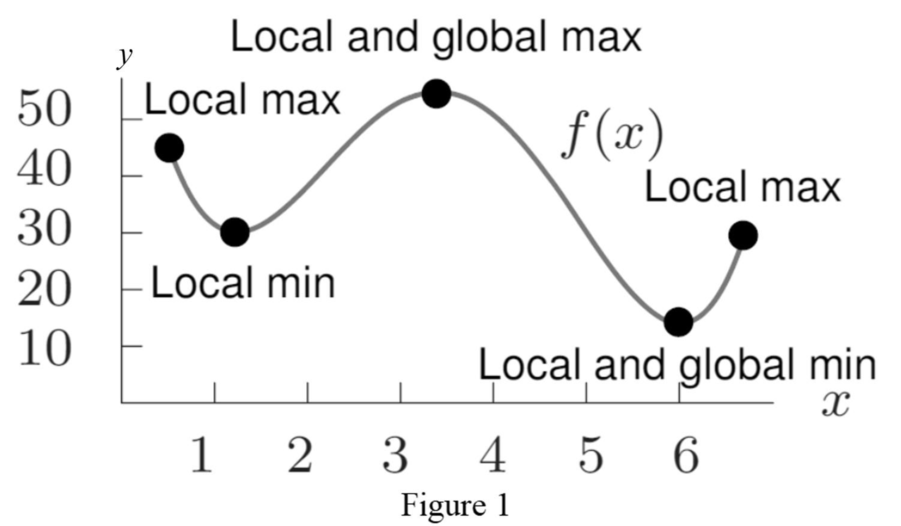
Redraw the graphs marking the critical points as shown below in Figure 1.
From Figure 1, it is notices that all critical points on the graph is showed.
Want to see more full solutions like this?
Subscribe now to access step-by-step solutions to millions of textbook problems written by subject matter experts!
The following graph shows a rough approximation of historical and projected median home prices for a country for the period 2000–2024.
Here, t is time in years since the start of 2000, and C(t) is the median home price in thousands of dollars. The locations of stationary points and points of inflection are indicated on the graph. Analyze the graph's important features, and interpret each feature in terms of the median home price.
The median home price was $_________ thousand at the start of 2000 (t = 0).
The median home price has two low points; first in the year_______ and again in the year___________ when it stood at $________ thousand;
The median home price peaked at the start of the year__________ at $_________ thousand.
The median home price was decreasing most rapidly at the start of the year__________ when it was $___________ thousand, and increasing most rapidly at the start of the year__________ when it was $_________ thousand.
Assuming that the trend shown in…
In Exercises 45–46, the domain of each piecewise function is
(-*,).
a. Graph each function.
b. Use the graph to determine the function's range.
S 5 if xs -1
45. f(x) =
-3 if x> -1
| 2x if x <0
46. f(x) =
if x2 0
The following graph shows a rough approximation of historical and projected median home prices for a country for the period 2000–2024.
Insert graph here:
Here, t is time in years since the start of 2000, and C(t) is the median home price in thousands of dollars. The locations of stationary points and points of inflection are indicated on the graph. Analyze the graph's important features, and interpret each feature in terms of the median home price.
The median home price was $_________ thousand at the start of 2000 (t = 0).
The median home price has two low points; first in the year_______ and again in the year___________ when it stood at $________ thousand;
The median home price peaked at the start of the year__________ at $_________ thousand.
The median home price was decreasing most rapidly at the start of the year__________ when it was $___________ thousand, and increasing most rapidly at the start of the year__________ when it was $_________ thousand.
Assuming…
Single Variable Calculus: Early Transcendentals (2nd Edition) - Standalone book
Knowledge Booster
Learn more about
Need a deep-dive on the concept behind this application? Look no further. Learn more about this topic, calculus and related others by exploring similar questions and additional content below.


 Algebra & Trigonometry with Analytic GeometryAlgebraISBN:9781133382119Author:SwokowskiPublisher:Cengage