
Develop a spreadsheet for computing the demand for any values of the input variables in the linear demand and nonlinear demand prediction models in Examples
To develop a spreadsheet for computing the demand for any values if the input variables in the linear demand and nonlinear demand prediction models.
Explanation of Solution
Given:
Linear model is,
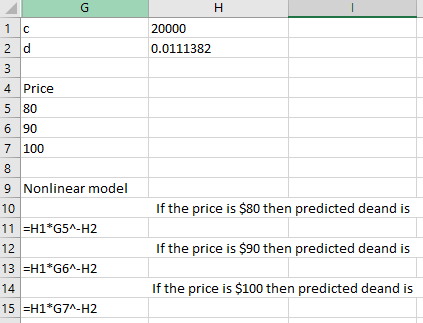
And Nonlinear model,
Following is the formulae used in spreadsheet for linear model:
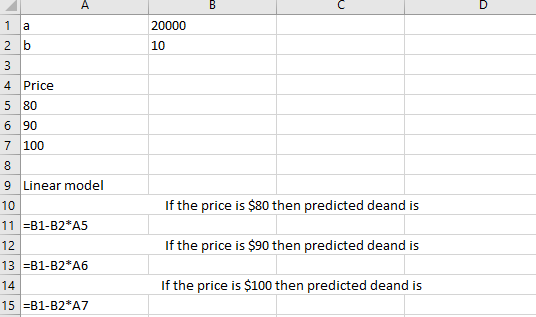
Following is the formulae used in spreadsheet for Nonlinear model:
Following is the output for linear model:
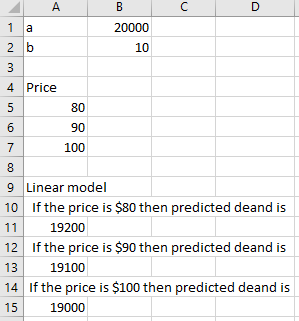
As per calculation, if the price increases then demand decreases.
Following is the output for Nonlinear model:
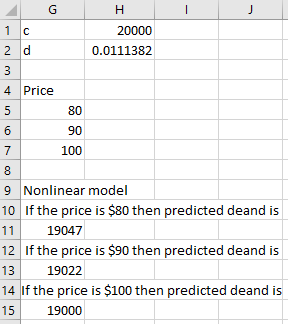
As per calculation, if the price increases then demand decreases.
Want to see more full solutions like this?
Chapter A1 Solutions
Business Analytics
Additional Math Textbook Solutions
APPLIED STAT.IN BUS.+ECONOMICS
Statistical Reasoning for Everyday Life (5th Edition)
Statistics: Informed Decisions Using Data (5th Edition)
Statistics Through Applications
Elementary Statistics (Text Only)
Elementary Statistics: A Step By Step Approach
- 23. Consider a simple economy with just two industries: farming and manufacturing. Farming consumes 1/2 of the food and 1/3 of the manufactured goods. Manufacturing consumes 1/2 of the food and 2/3 of the manufactured goods. Assuming the economy is closed and in equilibrium, find the relative outputs of the farming and manufacturing industries.arrow_forwardA manager of inventory systems believes that inventory models are important decision- making tools. The manager often uses an Economic Order Quantity policy, but has never considered a backorder model, because the company has always treated backorders as a bad practice to be avoided. However, with upper management's continued pressure to cut costs, you have been asked to analyze the economics of a backorder policy for some products. A specific product has annual demand of 800 units, an order cost of $150/order, an annual holding cost of $3/item, and a backorder cost of $20/item. Your task it to determine the annual savings, when compared with an EOQ model, that backorders would allow. Assume 250 working days per year.arrow_forwardSheet 1 and 2 are on the same imagearrow_forward
- 1) A small company has the marketing information that 35 units will sell daily at a price of $34.75 per unit, and that sales will rise to 36 units per day at a price of $33.06 per unit. Use this information to create a linear demand function, then create the associated revenue 6- function and find the price that will yield the maximum revenue.arrow_forwardTable 1. The manager of Carpet City outlet store needs to be able to forecast accurately demand for Soft Shang carpet. Demand for the past 20 weeks appears in table 1 below. week Demand Forecast Error ABS. Dev Squared Error APE 1 20 2 28 3 22 4 18 5 22 6 22 7 22 8 26 9 23 10 23 11 23 12 27 13 25 14 22 15 23 16 14 17 14 18 15 19 11 20 16 21 22 23 24…arrow_forwardINTERPRET THE RESULT1) Check for consistency in the relationship between quantity demand and the three explanatory variables as postulated in demand theory by indicating the change in the quantity demanded of the commodity for each unit change in the explanatory variables. 2)Find and interpret the adjusted and the unadjusted coefficient of determination.arrow_forward
- Could you also break down the (I-A)^-1 part more I am having trouble understanding that?arrow_forwardSuppose we obtain data on prices of big-screen televisions and estimate the following model: In(Price) = 4.06 + 0.06 * Size +0.23 * Wide + 0.34 * Plasma + 0.21 * LCD+0.09 * Memory where the dependent variable has been transformed, Size is the screen size measured in inches, Wide is a dummy variable equal to one if the television is a widescreen, Plasma is a dummy variable equal to one if the television is a Plasma screen, LCD is equal to one if the television is an LCD screen, and Memory is a dummy variable equal to one if the television has any memory card slots. What is the estimated price of a 42" Widescreen Plasma television with 2 memory card slots? Select one: O a. 7.24 O b. 7.33 1525.38 O d. 1394.09 • e 1881.83 Clear my choicearrow_forwardEconomics 2. (35) Consider the quarterly sales data:datal = {10, 31, 43, 16, 11, 33, 45, 17, 14, 46, 50, 21, 19, 41, 55,25). a) Forecast demand for 6th month by using 2 month MA. b) Forecast demand for 6th month by using by employing EWMA with a= 0:9 .c) Which forecast result you would prefer? and why?arrow_forward
- 1. Suppose that the straight line of a demand equation passes through points (10, 20) and (5, 30). Find the demand equation.arrow_forward5(a) What shall be the demand if price is set to be Rs.75/Lg linear regress model. S.No. Price (Rs./kg) Demand (Kg) 1 62 280 2 68 310 3 78 350 4 89 370 5. . 85 360 53 250 7 71 320 8 66 290 67 300arrow_forwardHow, if at all, do the maximum profit and optimal bottling policy change if the company has no minimum required production?arrow_forward
 Linear Algebra: A Modern IntroductionAlgebraISBN:9781285463247Author:David PoolePublisher:Cengage Learning
