Concept explainers
Videos
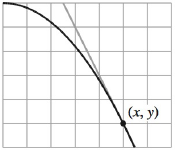
Approximating the Slope of a Graph In Exercises 1-4, approximate the slope of the graph at the point (x, y). (Each square on the grid is 1 unit by 1 unit.)
To calculate: The slope of the provided graph at the given point
The provided graph is shown below,

Answer to Problem 1RE
Solution:
The slope of the given curve at point
Explanation of Solution
Given Information:
The provided graph is shown below,
Each grid in the curve represents 1 unit by 1 unit as dimensions
Formula used:
Consider the equation of the given curve as
Here
Calculation:
The change in y is 4 units decreasing for 2 unit increase in x direction.
Hence, using formula for the slope of a function,
Here
The slope of the given graph is,
Now, as there is a decrease of 2 units in y as per increase in a unit of x
Therefore, the slope at point
Want to see more full solutions like this?
Chapter 2 Solutions
Calculus: An Applied Approach (MindTap Course List)


 Calculus: Early TranscendentalsCalculusISBN:9781285741550Author:James StewartPublisher:Cengage Learning
 Thomas' Calculus (14th Edition)CalculusISBN:9780134438986Author:Joel R. Hass, Christopher E. Heil, Maurice D. WeirPublisher:PEARSON
 Calculus: Early Transcendentals (3rd Edition)CalculusISBN:9780134763644Author:William L. Briggs, Lyle Cochran, Bernard Gillett, Eric SchulzPublisher:PEARSON
 Calculus: Early TranscendentalsCalculusISBN:9781319050740Author:Jon Rogawski, Colin Adams, Robert FranzosaPublisher:W. H. Freeman
 Calculus: Early Transcendental FunctionsCalculusISBN:9781337552516Author:Ron Larson, Bruce H. EdwardsPublisher:Cengage Learning