
MATLAB: An Introduction with Applications
6th Edition
ISBN: 9781119256830
Author: Amos Gilat
Publisher: John Wiley & Sons Inc
expand_more
expand_more
format_list_bulleted
Related questions
Question
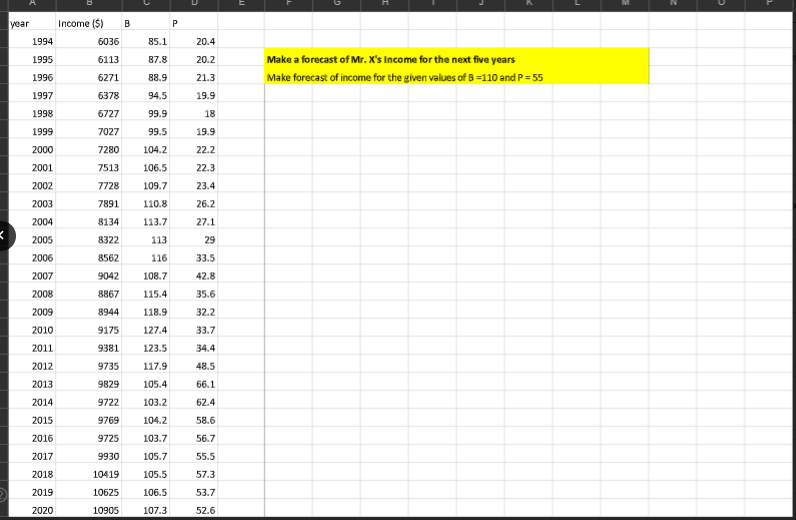

Transcribed Image Text:year
Income (S)
B
1994
6036
85.1
20.4
1995
6113
87.8
20.2
Make a forecast of Mr. X's Income for the next five years
1996
6271
88.9
21.3
Make forecast of income for the given values of B =110 and P= 55
1997
6378
94.5
19.9
1998
6727
99.9
18
1999
7027
99.5
19.9
2000
7280
104.2
22.2
2001
7513
106.5
22.3
2002
7728
109.7
23.4
2003
7891
110.8
26.2
2004
8134
113.7
27.1
2005
8322
113
29
2006
8562
116
33.5
2007
9042
108.7
42.8
2008
8867
115.4
35.6
2009
8944
118.9
32.2
2010
9175
127.4
33.7
2011
9381
123.5
34.4
2012
9735
117.9
48.5
2013
9829
105.4
66.1
2014
9722
103.2
62.4
2015
9769
104.2
58.6
2016
9725
103.7
56.7
2017
9930
105.7
55.5
2018
10419
105.5
57.3
2019
10625
106.5
53.7
2020
10905
107.3
52.6
Expert Solution
This question has been solved!
Explore an expertly crafted, step-by-step solution for a thorough understanding of key concepts.

Step by stepSolved in 3 steps with 1 images

Knowledge Booster

Similar questions
- The table shows the historical in-state tuition rates for the University of Kalamazoo. Use the data to answer the questions and round your answers to two decimal places. Academic year Rate of tuition for one semester 2008–2009 $3,812 2009–2010 $4,002 2010–2011 $4,441 2011–2012 $4,905 2012–2013 $5,181 What is the percentage increase in tuition from the 2008–2009 school year to the 2012–2013 school year?arrow_forwardWalmart Revenue The annual revenue of Walmart is given in the table below (source ). Walmart Annual Revenue (Billions of US dollars) 559.151 Year 2021 2020 2019 2018 2017 2016 2015 2014 2013 2012 2011 2010 2009 2008 2007 2006 2005 523.964 514.405 500.343 485.873 482.130 485.651 476.294 468.651 446.509 421.849 408.085 404.254 377.023 348.368 312.101 284.310 Apply linear regression to the data in the table to find a model y = mx + b, where y is Walmart's annual revenue in billions of US dollars, and a is the number of years since 2000. Use the model y = mx + b with m rounded to the nearest tenth and 6 rounded to the nearestarrow_forwardData set 3 74.6 73.3 70.0 74.2 71.7 72.1 79.1 74.7 71.9 76.2 71.6 70.4 76.0 61.6 73.9 72.8 67.0 66.8 67.5 70.8 73.9 74.5 73.7 70.4 69.4 70.0 75.7 69.5 72.7 60.0 79.4 72.0 74.0 79.9 68.5 75.6 61.3 72.0 73.8 76.0 78.2 60.4 75.8 73.9 77.4 68.6 75.5 71.2 65.4 75.1arrow_forward
- Monthly Profit of an Auto Repair Shop Month Jan-14 Feb-14 Mar-14 Apr-14 May-14 Jun-14 Jul-14 Aug-14 Sep-14 Profit ($) 17,12317,123 17,27317,273 16,05516,055 18,13818,138 19,76319,763 17,31017,310 19,13119,131 18,57818,578 20,37320,373 Step 1 of 4 : Determine the three-period moving average for the next time period. If necessary, round your answer to one decimal place.arrow_forwardWins Attendance (In Millions) 65 2.06 91 2.51 66 1.73 89 3.05 75 3.06 88 2.19 91 2.06 69 1.39 83 2.88 81 2.46 80 1.54 76 2.33 67 1.62 80 3.25 80 3.56 77 2.78 94 3.22 79 2.56 95 3.77 81 1.42 97 3.65 57 1.61 90 2.13 92 3.04 61 2.09 86 3.3 96 1.84 90 2.51 85 1.63 69 1.83 Draw a scatter diagram depicting the correlation between the two variables. Determine the correlation coefficient between the two variables using Excel. Present a regression output between a dependent and one independent variable. Obtain estimated coefficients and R-squared and interpret them. Write a short report on the findings.arrow_forwardEnd of month S&P 500 End of month S&P 500 End of month S&P 500 End of month S&P 500 September-77 96.53 April-80 106.29 November-82 138.53 July-85 191.85 October-77 92.34 May-80 111.24 December-82 140.64 August-85 190.92 November-77 94.83 June-80 114.24 January-83 145.30 September-85 188.63 December-77 95.10 July-80 121.67 February-83 148.06 October-85 182.08 January-78 89.25 August-80 122.38 March-83 152.96 November-85 189.82 February-78 87.04 September-80 125.46 April-83 164.43 December-85 202.17 March-78 89.21 October-80 127.47 May-83 162.39 January-86 211.28 April-78 96.83 November-80 140.52 June-83 167.64 February-86 226.92 May-78 97.24 December-80 135.76 July-83 162.56 March-86 238.90 June-78 95.53 January-81 129.55 August-83 164.40 April-86 235.52 July-78 100.68 February-81 131.27 September-83 166.07 May-86 247.35 August-78 103.29 March-81 136.00 October-83 163.55 June-86 250.84 September-78 102.54 April-81 132.81 November-83 166.40…arrow_forward
arrow_back_ios
arrow_forward_ios
Recommended textbooks for you
- MATLAB: An Introduction with ApplicationsStatisticsISBN:9781119256830Author:Amos GilatPublisher:John Wiley & Sons Inc
 Probability and Statistics for Engineering and th...StatisticsISBN:9781305251809Author:Jay L. DevorePublisher:Cengage Learning
 Statistics for The Behavioral Sciences (MindTap C...StatisticsISBN:9781305504912Author:Frederick J Gravetter, Larry B. WallnauPublisher:Cengage Learning
  Elementary Statistics: Picturing the World (7th E...StatisticsISBN:9780134683416Author:Ron Larson, Betsy FarberPublisher:PEARSON
 The Basic Practice of StatisticsStatisticsISBN:9781319042578Author:David S. Moore, William I. Notz, Michael A. FlignerPublisher:W. H. Freeman
 Introduction to the Practice of StatisticsStatisticsISBN:9781319013387Author:David S. Moore, George P. McCabe, Bruce A. CraigPublisher:W. H. Freeman
MATLAB: An Introduction with Applications
Statistics
ISBN:9781119256830
Author:Amos Gilat
Publisher:John Wiley & Sons Inc
Probability and Statistics for Engineering and th...
Statistics
ISBN:9781305251809
Author:Jay L. Devore
Publisher:Cengage Learning
Statistics for The Behavioral Sciences (MindTap C...
Statistics
ISBN:9781305504912
Author:Frederick J Gravetter, Larry B. Wallnau
Publisher:Cengage Learning
Elementary Statistics: Picturing the World (7th E...
Statistics
ISBN:9780134683416
Author:Ron Larson, Betsy Farber
Publisher:PEARSON
The Basic Practice of Statistics
Statistics
ISBN:9781319042578
Author:David S. Moore, William I. Notz, Michael A. Fligner
Publisher:W. H. Freeman
Introduction to the Practice of Statistics
Statistics
ISBN:9781319013387
Author:David S. Moore, George P. McCabe, Bruce A. Craig
Publisher:W. H. Freeman