
FINANCIAL ACCOUNTING
10th Edition
ISBN: 9781259964947
Author: Libby
Publisher: MCG
expand_more
expand_more
format_list_bulleted
Related questions
Concept explainers
Question
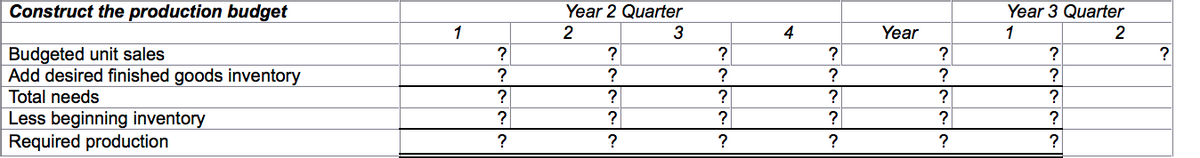

Transcribed Image Text:# Constructing the Production Budget
This table outlines the framework for developing a production budget across various time periods. The budget is segmented into years and quarters to provide a clear overview of production needs over time.
## Table Structure
### Columns:
- **Year 2 Quarter**: Lists quarters 1 through 4 for Year 2, and aggregates the data for the entire year.
- **Year 3 Quarter**: Includes quarters 1 and 2.
### Rows:
1. **Budgeted Unit Sales**: The expected sales volume for each period. These figures are essential for determining production needs.
2. **Add Desired Finished Goods Inventory**: The amount of finished goods inventory desired at the end of each period to meet future sales without interruption.
3. **Total Needs**: The sum of budgeted unit sales and desired finished goods inventory, representing the total units required for each period.
4. **Less Beginning Inventory**: The inventory already available at the start of each period, which will reduce the production requirements.
5. **Required Production**: The total production necessary to meet both sales and inventory needs, calculated by subtracting the beginning inventory from total needs.
### Purpose:
This detailed structure is used by businesses to ensure that they can meet sales demands and maintain appropriate inventory levels, while also optimizing production resources. Filling in the cells with actual numeric data allows for effective planning and resource allocation.

Transcribed Image Text:**Budgeted Unit Sales and Financial Projections**
**Sales Data:**
- **Year 2 Quarter:**
- Q1: 40,000 units
- Q2: 60,000 units
- Q3: 100,000 units
- Q4: 50,000 units
- **Year 3 Quarter:**
- Q1: 70,000 units
- Q2: 80,000 units
**Price and Receivables:**
- Selling price per unit: $12
- Accounts receivable, beginning balance: $65,000
- Sales collected in the same quarter: 75%
- Sales collected in the following quarter: 25%
**Inventory Management:**
- Desired ending finished goods inventory: 30% of the next quarter's budgeted unit sales
- Beginning finished goods inventory: 12,000 units
- Raw materials needed per unit: 5 pounds
- Desired ending inventory of raw materials: 10% of next quarter's production needs
- Beginning raw materials inventory: 23,000 pounds
**Cost and Payment Details:**
- Raw material costs: $0.80 per pound
- Payment for raw materials:
- 60% in the purchase quarter
- 40% in the following quarter
- Accounts payable for raw materials, beginning balance: $81,500
**Labor and Overheads:**
- Direct labor cost: $15 per hour
- Direct labor hour per unit: 0.2 hours
- Variable manufacturing overhead (MOH) rate: $2 per hour
- Total fixed MOH: $60,000
**Selling, Administrative, and Financials:**
- Variable S&A expense rate: $1.80 per unit
- Minimum cash balance: $50,000
- Annual interest rate: 12%
This data is crucial for understanding and planning production, sales, and financial strategies over the specified quarters.
Expert Solution
This question has been solved!
Explore an expertly crafted, step-by-step solution for a thorough understanding of key concepts.

This is a popular solution

Trending nowThis is a popular solution!

Step by stepSolved in 2 steps

Knowledge Booster


Learn more about
Need a deep-dive on the concept behind this application? Look no further. Learn more about this topic, accounting and related others by exploring similar questions and additional content below.Similar questions
- QUESTION 50 Answer the following questions using the information below: Edna's Flowering Plants provides the following information for the month of May: Actual Budget Sales in units Contribution margin per unit Tulips Geraniums 1,950 $11 1,800 $18 Tulips Geraniums 2,250 $10 1,500 $20 What is the budgeted contribution margin per composite unit for the budgeted mix? O A. $14.00 OB. $13.80 O C. $14.80 O D. $14.36arrow_forwardData Year 2 Quarter Year 3 Quarter 1 2 3 4 1 2 Budgeted unit sales 40,000 60,000 100,000 50,000 70,000 80,000 • Selling price per unit • Accounts receivable, beginning balance • Sales collected in the quarter sales are made • Sales collected in the quarter after sales are made • Desired ending finished goods inventory is • Finished goods inventory, beginning • Raw materials required to produce one unit • Desired ending inventory of raw materials is • Raw materials inventory, beginning • Raw material costs • Raw materials purchases are paid and • Accounts payable for raw materials, beginning balance $12 per unit $65,000 75% 25% 30% of the budgeted unit sales of the next quarter 12,000 units 5 pounds 10% of the next quarter's production needs 23,000 pounds $0.80 per pound 60% in the quarter the purchases are made 40% in the quarter following purchase $81,500 •Direct labor cost per hour •Direct labor hour per unit $15 per hour 0.2 hour per unit $2 per hour $60,000 •Variable MOH rate…arrow_forwardQuestion 5.1 Stark and Company would like to evaluate one of the product lines that they sell to the defense department. Every month the Stark and Company produce an identical number of units, although the sales in units differ from month to month. Selling price Units in beginning inventory $105 110 Units produced 6,400 Units sold 6,100 Units in ending inventory Variable costs per unit: 410 Direct materials $62 Direct labour $48 Variable manufacturing overhead Variable selling and administrative Fixed costs: $3 $7 Fixed manufacturing overhead Fixed selling and administrative $64,000 $35,600 Submission Instructions: 1. Under variable costing, identify the unit product cost for the month. 2. What is the unit product cost for the month under absorption costing? 3. Prepare an income statement for the month using the contribution format and the variable costing method. 4. Prepare an income statement for the month using the absorption costing method.arrow_forward
- Question 15 nts View Policies Current Attempt in Progress The direct materials budget shows: upport Desired ending direct 48000 pounds materials 66000 pounds Total materials required 60200 pounds Direct materials purchases The total direct materials needed for production is 5800 pounds. O 126200 pounds. O 18000 pounds. O 12200 pounds. hp tsd Ins prt sc 19 fil 44 & 5 7 Y Darrow_forwardPlease do not give solution in image format thankuarrow_forwardQuestion 6 View Policies Current Attempt in Progress Crane Company determines that 59000 pounds of direct materials are needed for production in July. There are 3700 pounds of direct materials on hand at July 1 and the desired ending inventory is 3300 pounds. If the cost per unit of direct materials is $3, what is the budgeted total cost of direct materials purchases? ort $175800 O $180600. O $178200. O $173400. ea Chp ins prt sc fho 12 home delete % 5 & 7 backspace lock T P hom G H K enter B pause t shift ctri NM Narrow_forward
- Question 19arrow_forwardDownload the Applying Excel form and enter formulas in all cells that contain question marks. For example, in cell B26 enter the formula "= B5". Required: 1. Check your worksheet by changing the budgeted unit sales in Quarter 2 of Year 2 in cell C5 to 75,000 units. The total expected cash collections for the year should now be $2,085,000. The required production for the year should be 274,000 units. The cost of raw materials to be purchased for the year should be $1,106,800, whereas the total cash disbursements for the year should be $1,095,980. If you do not get this answer, find the errors in your worksheet and correct them.arrow_forward
arrow_back_ios
arrow_forward_ios
Recommended textbooks for you
 AccountingAccountingISBN:9781337272094Author:WARREN, Carl S., Reeve, James M., Duchac, Jonathan E.Publisher:Cengage Learning,
 Accounting Information SystemsAccountingISBN:9781337619202Author:Hall, James A.Publisher:Cengage Learning,
 Horngren's Cost Accounting: A Managerial Emphasis...AccountingISBN:9780134475585Author:Srikant M. Datar, Madhav V. RajanPublisher:PEARSON
 Intermediate AccountingAccountingISBN:9781259722660Author:J. David Spiceland, Mark W. Nelson, Wayne M ThomasPublisher:McGraw-Hill Education
 Financial and Managerial AccountingAccountingISBN:9781259726705Author:John J Wild, Ken W. Shaw, Barbara Chiappetta Fundamental Accounting PrinciplesPublisher:McGraw-Hill Education
Accounting
Accounting
ISBN:9781337272094
Author:WARREN, Carl S., Reeve, James M., Duchac, Jonathan E.
Publisher:Cengage Learning,
Accounting Information Systems
Accounting
ISBN:9781337619202
Author:Hall, James A.
Publisher:Cengage Learning,
Horngren's Cost Accounting: A Managerial Emphasis...
Accounting
ISBN:9780134475585
Author:Srikant M. Datar, Madhav V. Rajan
Publisher:PEARSON
Intermediate Accounting
Accounting
ISBN:9781259722660
Author:J. David Spiceland, Mark W. Nelson, Wayne M Thomas
Publisher:McGraw-Hill Education
Financial and Managerial Accounting
Accounting
ISBN:9781259726705
Author:John J Wild, Ken W. Shaw, Barbara Chiappetta Fundamental Accounting Principles
Publisher:McGraw-Hill Education