MATLAB: An Introduction with Applications
6th Edition
ISBN: 9781119256830
Author: Amos Gilat
Publisher: John Wiley & Sons Inc
expand_more
expand_more
format_list_bulleted
Question
The article, “Should You Report That Fender-Bender?” (Consumer Reports, 2013:15), reported that 7 in 10 automobile accidents involve a single vehicle. A random sample of 25 accident reports is selected.
Include your calculator
- What is the
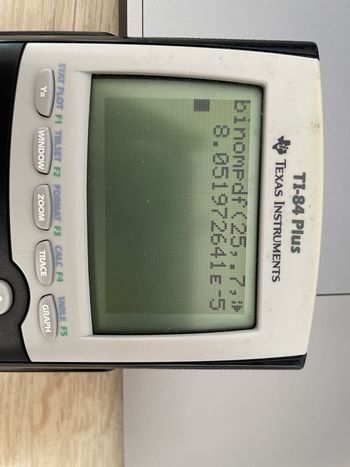
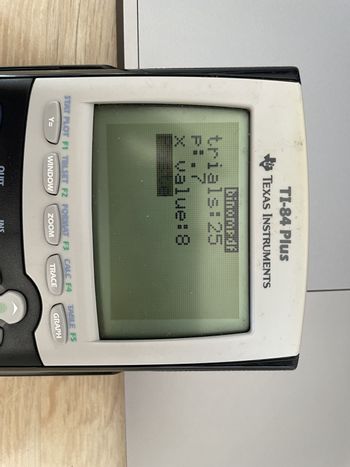
probability that exactly 8 accidents involve a single vehicle? I am trying to complete this study guide example but am stuck. I am using a TI-84 calculator and using the binompdf function. I enter 25 trials, .7 for p, and 8 for x but I get 8.051927. This cant be the answer since its too bing what am I doing wrong?
Expert Solution
This question has been solved!
Explore an expertly crafted, step-by-step solution for a thorough understanding of key concepts.
This is a popular solution
Trending nowThis is a popular solution!
Step by stepSolved in 3 steps

Follow-up Questions
Read through expert solutions to related follow-up questions below.
Follow-up Question
When I enter this into my TI-84 calculator, I get 8.051972641.... How does that change into 0.00008051927?

Transcribed Image Text:TI-84 Plus
TEXAS INSTRUMENTS
binompdf (25,.7,#
8.051972641E-5
417
STAT PLOT F1 TBLSET F2 FORMAT F3 CALE F4
Y=
WINDOW
ZOOM
TRACE
TABLE F5
GRAPH

Transcribed Image Text:TI-84 Plus
TEXAS INSTRUMENTS
binompdf
trials:25
P1.7
x value:8
STAT PLOT F1 TBLSET F2 FORMAT F3 CALC F4
Y=
WINDOW
ZOOM
TRACE
QUIT
INS
N
TABLE F5
GRAPH
Solution
by Bartleby Expert
Follow-up Questions
Read through expert solutions to related follow-up questions below.
Follow-up Question
When I enter this into my TI-84 calculator, I get 8.051972641.... How does that change into 0.00008051927?

Transcribed Image Text:TI-84 Plus
TEXAS INSTRUMENTS
binompdf (25,.7,#
8.051972641E-5
417
STAT PLOT F1 TBLSET F2 FORMAT F3 CALE F4
Y=
WINDOW
ZOOM
TRACE
TABLE F5
GRAPH

Transcribed Image Text:TI-84 Plus
TEXAS INSTRUMENTS
binompdf
trials:25
P1.7
x value:8
STAT PLOT F1 TBLSET F2 FORMAT F3 CALC F4
Y=
WINDOW
ZOOM
TRACE
QUIT
INS
N
TABLE F5
GRAPH
Solution
by Bartleby Expert
Knowledge Booster
Similar questions
- If a journal publishes 50 scientific papers per year, each using a significance level of 5%, what is the probability at least one of them encountered a type I error?arrow_forward# 3. Use Minitab to simulate 1000 rolls of five dice. Find the number of times that the sum of the five dice is exactly 20. Enter that value here. frequency approach to estimate the probability of getting a 20 when five dice are rolled. Enter the estimated probability here. Based on that result, use the relative Write a sentence or two explaining the difference (advantage or disadvantage) of the classical approach to probability compared to the relative frequency approach to probability. Refer to the results from #1, 2, 3 above in your explanation.arrow_forwardA random experiment was run 23 times with groups of 24 mice. Each time the experiment was run, 4 mice were initially infected with a disease; the remaining mice were susceptible to contracting the disease. After one day, they measured the number of number of newly infected mice (not including those originally infected). They found the following frequency table: Newly infected mice Newly infected mice 4 5 6 7 8 9 10 11 Frequency 1 2 2 6 5 4 2 1 Determine the expected probability of transmission for this particular variant of disease. Round your answer to three decimal places.arrow_forward
- Part 1 of 4 Victoria, an accomplished marathon runner, claims that the standard deviation for her time to run a 26.2 mile marathon is less than 17.5 minutes. To test her claim, Victoria looks up 11 of her race times (in minutes): 227.2, 233.3, 259.7, 265.8, 252.1, 228.8, 222.6, 202.9, 214.5, 237.2, 267.7 Perform a hypothesis test using a 9% level of significance to test Victoria's claim. Step 1: State the null and alternative hypotheses. 17.5 Ha:0arrow_forwardAccording to the GSS 2018 dataset, 51% of 218 college graduates reported being interested in environmental issues compared with 43% of 167 high school graduates. What is the research hypothesis? Should you conduct a one- or two-tailed test? Why?arrow_forwardplease do the full problem as it is part of just one!!! please and thx.arrow_forwardIn June 2015, Gallup conducted a poll of a random sample of 14,683 adults to determine the well-being of people living in the United States. One question asked, "Did you exercise at least 30 minutes for 3 or more days in the past week?" In the survey, 58.9% of males and 52.7% of females responded yes to this question. Which of the following is true about this scenario? A. O 58.9% and 52.7% are both parameters. B. O 58.9% and 52.7% are both statistics. C. If we took another random sample of 14,683 adults, we would expect to get the exact same results.arrow_forwardIn an article that appears on a website,† Carlton Gunn, a public defender in Seattle, Washington, wrote about how he uses statistics in his work as an attorney. He states the following. I personally have used statistics in trying to challenge the reliability of drug testing results. Suppose the chance of a mistake in the taking and processing of a urine sample for a drug test is just 1 in 100. And your client has a "dirty" (i.e., positive) test result. Only a 1 in 100 chance that it could be wrong? Not necessarily. If the vast majority of all tests given—say 99 in 100—are truly clean, then you get one false dirty and one true dirty in every 100 tests, so that half of the dirty tests are false. Define the following events as given below. TD = event that the test result is dirty TC = event that the test result is clean D = event that the person tested is actually dirty C = event that the person tested is actually clean (a) Using the information in the quote, compute the following…arrow_forwardUse the three-read strategy to understand the following exercise from a statistics textbook, and then proceed to complete the exercise. A popular urban legend is that more babies than usual are born during certain phases of the lunar cycle, especially near the full moon. Suppose that a certain paper classified births according to the lunar cycle. Data for a sample of randomly selected births, consistent with summary quantities in the paper, are given in the accompanying table. Lunar Phase Numberof Days Numberof Births New Moon 24 7,670 Waxing Crescent 152 48,442 First Quarter 24 7,589 Waxing Gibbous 149 47,814 Full Moon 24 7,711 Waning Gibbous 150 47,595 Last Quarter 24 7,733 Waning Crescent 152 48,240 Calculate the value of the Χ2 goodness-of-fit test statistic that could be used to determine if the distribution of number of births in each lunar phase is what would be expected based on the number of days in each phase. Use the value of the test statistic to…arrow_forwardA political scientist claims that 38% of first-year college students characterize themselves as being “moderate” or “middle of the road” as far as their political affiliation is concerned. Believing this claimed value is too high, you survey a random sample of 400 first-year college students and find that 120 characterize themselves as being “moderate” or “middle of the road.” Based on this information, what will the test statistic be? Choose the answer below that is closest to what you calculate, and try not to do a lot of rounding until you get to the very end of your calculations. 1. -0.3 2. -1.2 3. -2.6 4. -3.3 5. None of the other answer options are correct because the test statistic should be positive, not negative.arrow_forwardSection 4.1 Introduction to Probability Score: 4.67/15 4/15 answered Question 10 Giving a test to a group of students, the grades and gender are summarized below valuations A B Male 10 18 6. Female 9. 16 7 If one student was chosen at random, find the probability that the student was male. Probability = (Please enter a reduced fraction.) Submit Question ...jpg pic 16131095275...jpg pic_16131095275..jpg O Zoomday17bsp21.docx pic 1615670389...jpg 17 WX P N 吕口 F3 F4 F5 F2arrow_forwardWHen writing a null hypothesis for a two sample t test. Do you write U1 = U2 or U1 - U2 = 0? Or do both of them work?arrow_forwardarrow_back_iosarrow_forward_ios
Recommended textbooks for you
 MATLAB: An Introduction with ApplicationsStatisticsISBN:9781119256830Author:Amos GilatPublisher:John Wiley & Sons Inc
 Probability and Statistics for Engineering and th...StatisticsISBN:9781305251809Author:Jay L. DevorePublisher:Cengage Learning
 Statistics for The Behavioral Sciences (MindTap C...StatisticsISBN:9781305504912Author:Frederick J Gravetter, Larry B. WallnauPublisher:Cengage Learning
 Elementary Statistics: Picturing the World (7th E...StatisticsISBN:9780134683416Author:Ron Larson, Betsy FarberPublisher:PEARSON
 The Basic Practice of StatisticsStatisticsISBN:9781319042578Author:David S. Moore, William I. Notz, Michael A. FlignerPublisher:W. H. Freeman
 Introduction to the Practice of StatisticsStatisticsISBN:9781319013387Author:David S. Moore, George P. McCabe, Bruce A. CraigPublisher:W. H. Freeman

MATLAB: An Introduction with Applications
Statistics
ISBN:9781119256830
Author:Amos Gilat
Publisher:John Wiley & Sons Inc

Probability and Statistics for Engineering and th...
Statistics
ISBN:9781305251809
Author:Jay L. Devore
Publisher:Cengage Learning

Statistics for The Behavioral Sciences (MindTap C...
Statistics
ISBN:9781305504912
Author:Frederick J Gravetter, Larry B. Wallnau
Publisher:Cengage Learning

Elementary Statistics: Picturing the World (7th E...
Statistics
ISBN:9780134683416
Author:Ron Larson, Betsy Farber
Publisher:PEARSON

The Basic Practice of Statistics
Statistics
ISBN:9781319042578
Author:David S. Moore, William I. Notz, Michael A. Fligner
Publisher:W. H. Freeman

Introduction to the Practice of Statistics
Statistics
ISBN:9781319013387
Author:David S. Moore, George P. McCabe, Bruce A. Craig
Publisher:W. H. Freeman