
FINANCIAL ACCOUNTING
10th Edition
ISBN: 9781259964947
Author: Libby
Publisher: MCG
expand_more
expand_more
format_list_bulleted
Related questions
Question
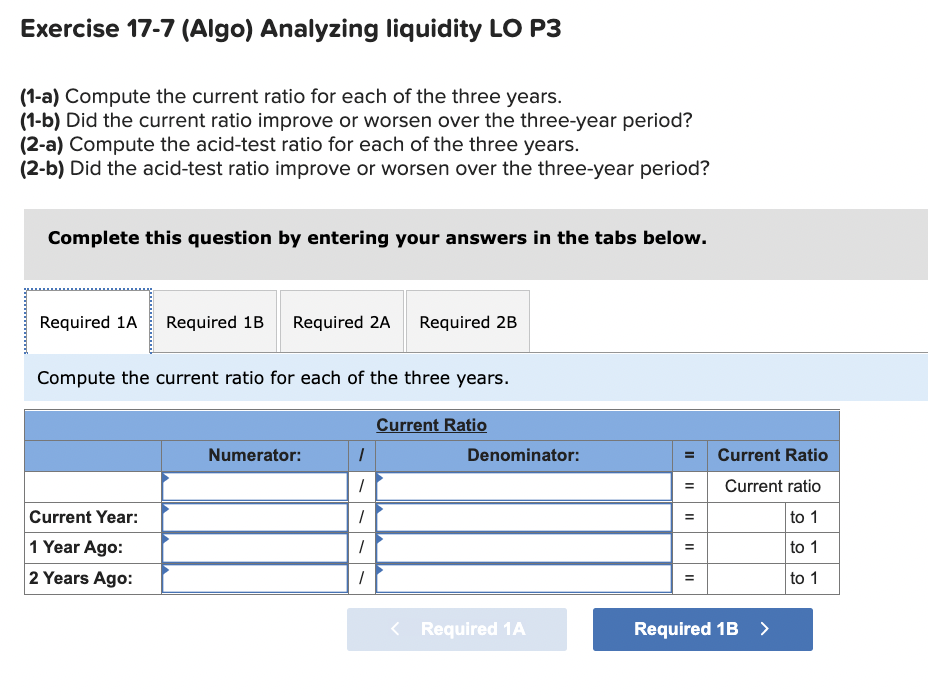

Transcribed Image Text:Exercise 17-7 (Algo) Analyzing liquidity LO P3
(1-a) Compute the current ratio for each of the three years.
(1-b) Did the current ratio improve or worsen over the three-year period?
(2-a) Compute the acid-test ratio for each of the three years.
(2-b) Did the acid-test ratio improve or worsen over the three-year period?
Complete this question by entering your answers in the tabs below.
Required 1A Required 1B Required 2A Required 2B
Compute the current ratio for each of the three years.
Current Year:
1 Year Ago:
2 Years Ago:
Numerator:
1
1
1
1
1
Current Ratio
Denominator:
< Required 1A
=
II
=
II
Current Ratio
Current ratio
to 1
to 1
to 1
Required 1B >
![Required information
Use the following information for the Exercises below. (Algo)
[The following information applies to the questions displayed below.]
Simon Company's year-end balance sheets follow.
At December 31
Assets
Cash
Accounts receivable, net
Merchandise inventory
Prepaid expenses
Plant assets, net
Total assets
Liabilities and Equity
Accounts payable
Long-term notes payable
Common stock, $10 par value
Retained earnings
Total liabilities and equity.
Current Year
$ 25,693
75,195
91,790
7,868
226,383
$426,929
1 Year Ago
$ 30,032
51,526
68,088
7,729
210,667
$ 368,042
2 Years Ago
$ 60,955
86,343
$ 106,305
81,065
162,500
$ 40,894
66,412
163,500
163,500
57,244
77,059
38,994
$ 426,929 $ 368,042 $ 309,800
$ 31,284
40,485
44,871
3,408
189,752
$ 309,800
For both the current year and one year ago, compute the following ratios:](https://content.bartleby.com/qna-images/question/f2bfa172-bfc6-4a2e-9589-90b7bd2d30c6/3a26fb6d-6bfd-4f39-ac93-e3b30323b58e/aloag4d_processed.png)
Transcribed Image Text:Required information
Use the following information for the Exercises below. (Algo)
[The following information applies to the questions displayed below.]
Simon Company's year-end balance sheets follow.
At December 31
Assets
Cash
Accounts receivable, net
Merchandise inventory
Prepaid expenses
Plant assets, net
Total assets
Liabilities and Equity
Accounts payable
Long-term notes payable
Common stock, $10 par value
Retained earnings
Total liabilities and equity.
Current Year
$ 25,693
75,195
91,790
7,868
226,383
$426,929
1 Year Ago
$ 30,032
51,526
68,088
7,729
210,667
$ 368,042
2 Years Ago
$ 60,955
86,343
$ 106,305
81,065
162,500
$ 40,894
66,412
163,500
163,500
57,244
77,059
38,994
$ 426,929 $ 368,042 $ 309,800
$ 31,284
40,485
44,871
3,408
189,752
$ 309,800
For both the current year and one year ago, compute the following ratios:
Expert Solution
This question has been solved!
Explore an expertly crafted, step-by-step solution for a thorough understanding of key concepts.

This is a popular solution

Trending nowThis is a popular solution!

Step by stepSolved in 3 steps

Follow-up Questions
Read through expert solutions to related follow-up questions below.
Follow-up Question
I need this format for the second required, thank you
![### Financial Ratio Analysis: Current and Acid-Test Ratios
#### Objective:
This section focuses on computing and analyzing two important financial ratios over a three-year period:
1. **Current Ratio**
2. **Acid-Test Ratio**
#### Tasks:
1. **Current Ratio**
- **1-a:** Compute the current ratio for each of the three years.
- **1-b:** Analyze whether the current ratio improved or worsened over the three-year period.
2. **Acid-Test Ratio**
- **2-a:** Compute the acid-test ratio for each of the three years.
- **2-b:** Analyze whether the acid-test ratio improved or worsened over the three-year period.
#### Instructions:
Use the interactive tabs to enter your computations.
### Detailed Explanation of the Acid-Test Ratio Calculation
The **Acid-Test Ratio**, also known as the quick ratio, measures a company’s ability to meet its short-term obligations using its most liquid assets.
#### Formula:
\[ \text{Acid-Test Ratio} = \frac{\text{Current Assets} + \text{Short-term Investments}}{\text{Denominator}} \]
##### Components:
- **Numerator:** Sum of Current Assets and Short-term Investments.
- **Denominator:** Usually refers to current liabilities, not specified in the image.
##### Computation Table:
- **Current Year:** Input data for current assets and short-term investments to calculate the ratio.
- **1 Year Ago:** Input data for the previous year.
- **2 Years Ago:** Input data for two years prior.
Each computed value will form an Acid-Test Ratio expressed as:
\[ X \text{ to } 1 \]
Use this table to track the liquidity changes over the three years. To input your calculations, click on the relevant tab (e.g., Required 2A). After completing your data entry, proceed to analyze the trends by answering the next sections.
Keep this information in mind as you evaluate the financial health of your organization through these ratios.](https://content.bartleby.com/qna-images/question/f2bfa172-bfc6-4a2e-9589-90b7bd2d30c6/1f1a5c8c-3817-4c1e-8b36-a6d1a71ffd9b/awu869a_processed.png)
Transcribed Image Text:### Financial Ratio Analysis: Current and Acid-Test Ratios
#### Objective:
This section focuses on computing and analyzing two important financial ratios over a three-year period:
1. **Current Ratio**
2. **Acid-Test Ratio**
#### Tasks:
1. **Current Ratio**
- **1-a:** Compute the current ratio for each of the three years.
- **1-b:** Analyze whether the current ratio improved or worsened over the three-year period.
2. **Acid-Test Ratio**
- **2-a:** Compute the acid-test ratio for each of the three years.
- **2-b:** Analyze whether the acid-test ratio improved or worsened over the three-year period.
#### Instructions:
Use the interactive tabs to enter your computations.
### Detailed Explanation of the Acid-Test Ratio Calculation
The **Acid-Test Ratio**, also known as the quick ratio, measures a company’s ability to meet its short-term obligations using its most liquid assets.
#### Formula:
\[ \text{Acid-Test Ratio} = \frac{\text{Current Assets} + \text{Short-term Investments}}{\text{Denominator}} \]
##### Components:
- **Numerator:** Sum of Current Assets and Short-term Investments.
- **Denominator:** Usually refers to current liabilities, not specified in the image.
##### Computation Table:
- **Current Year:** Input data for current assets and short-term investments to calculate the ratio.
- **1 Year Ago:** Input data for the previous year.
- **2 Years Ago:** Input data for two years prior.
Each computed value will form an Acid-Test Ratio expressed as:
\[ X \text{ to } 1 \]
Use this table to track the liquidity changes over the three years. To input your calculations, click on the relevant tab (e.g., Required 2A). After completing your data entry, proceed to analyze the trends by answering the next sections.
Keep this information in mind as you evaluate the financial health of your organization through these ratios.
Solution
by Bartleby Expert
Follow-up Questions
Read through expert solutions to related follow-up questions below.
Follow-up Question
I need this format for the second required, thank you
Transcribed Image Text:### Financial Ratio Analysis: Current and Acid-Test Ratios
#### Objective:
This section focuses on computing and analyzing two important financial ratios over a three-year period:
1. **Current Ratio**
2. **Acid-Test Ratio**
#### Tasks:
1. **Current Ratio**
- **1-a:** Compute the current ratio for each of the three years.
- **1-b:** Analyze whether the current ratio improved or worsened over the three-year period.
2. **Acid-Test Ratio**
- **2-a:** Compute the acid-test ratio for each of the three years.
- **2-b:** Analyze whether the acid-test ratio improved or worsened over the three-year period.
#### Instructions:
Use the interactive tabs to enter your computations.
### Detailed Explanation of the Acid-Test Ratio Calculation
The **Acid-Test Ratio**, also known as the quick ratio, measures a company’s ability to meet its short-term obligations using its most liquid assets.
#### Formula:
\[ \text{Acid-Test Ratio} = \frac{\text{Current Assets} + \text{Short-term Investments}}{\text{Denominator}} \]
##### Components:
- **Numerator:** Sum of Current Assets and Short-term Investments.
- **Denominator:** Usually refers to current liabilities, not specified in the image.
##### Computation Table:
- **Current Year:** Input data for current assets and short-term investments to calculate the ratio.
- **1 Year Ago:** Input data for the previous year.
- **2 Years Ago:** Input data for two years prior.
Each computed value will form an Acid-Test Ratio expressed as:
\[ X \text{ to } 1 \]
Use this table to track the liquidity changes over the three years. To input your calculations, click on the relevant tab (e.g., Required 2A). After completing your data entry, proceed to analyze the trends by answering the next sections.
Keep this information in mind as you evaluate the financial health of your organization through these ratios.
Solution
by Bartleby Expert
Knowledge Booster


Learn more about
Need a deep-dive on the concept behind this application? Look no further. Learn more about this topic, accounting and related others by exploring similar questions and additional content below.Similar questions
- Excerpts from Sydner Corporation's most recent balance sheet appear below: Current assets: Cash Accounts receivable, net Inventory Prepaid expenses Total current assets Total current liabilities Year 2 Year 1 $ 140 $ 160 210 230 240 200 10 10 $ 600 $ 600 $360 $ 330 Sales on account in Year 2 amounted to $1,390 and the cost of goods sold was $900. The accounts receivable turnover for Year 2 is closest to:arrow_forwardSimon Company’s year-end balance sheets follow. At December 31 Current Yr 1 Yr Ago 2 Yrs Ago Assets Cash $ 31,800 $ 35,625 $ 37,800 Accounts receivable, net 89,500 62,500 50,200 Merchandise inventory 112,500 82,500 54,000 Prepaid expenses 10,700 9,375 5,000 Plant assets, net 278,500 255,000 230,500 Total assets $ 523,000 $ 445,000 $ 377,500 Liabilities and Equity Accounts payable $ 129,900 $ 75,250 $ 51,250 Long-term notes payable secured bymortgages on plant assets 98,500 101,500 83,500 Common stock, $10 par value 163,500 163,500 163,500 Retained earnings 131,100 104,750 79,250 Total liabilities and equity $ 523,000 $ 445,000 $ 377,500 (1-a) Compute the current ratio for each of the three years.(1-b) Did the current ratio improve or worsen over the three…arrow_forwardPatton Corporation had the following items on its financial statements for two recent years: Line Item Description Year 2 Year 1 Sales $2,500,000 $2,000,000 Cost of goods sold 1,975,000 1,600,000 Cash 500,000 475,000 Temporary investments 150,000 150,000 Accounts receivable (net) 200,000 175,000 Inventory 325,000 300,000 Accounts payable 450,000 400,000 Based on these data, calculate Patton Corporation’s number of days’ sales in inventory for Year 2.a. 3.2b. 57.8c. 5.7d. 6.3arrow_forward
- Required information [The following information applies to the questions displayed below.) Income statements for the current year and one year ago, follow. Assume that all sales are on credit. For Year Ended December 31 Sales Cost of goods sold. Other operating expenses Interest expense Income tax expense Total costs and expenses Net income Earnings per share. Year-end balance sheets follow. At December 31 Assets Cash Accounts receivable, net Inventory Prepaid rent Machinery, net Total assets Liabilities and Equity Accounts payable Long-term notes payable Common stock Retained earnings Total liabilities and equity Current Year $ 121,756 92,867 162,500 121,838 $ 498,961 $ 395,676 201,081 11,027 8,432 $ 648,649 Current Year 1 Year Ago 2 Years Ago $ 33,723 35, 135 $ 28,850 87,882 107,277 59,015 46,378 80,371 49,388 9,214 9,196 265,756 3,943 220,056 247,816 $ 498,961 $430,139 $ 354,900 $ 74,147 101,900 162,500 91,592 $430,139 616,216 $ 32,433 $ 2.00 $ 45,910 76,080 162,500 70,410 $ 354,900…arrow_forwardUse the following information for the Exercises below. (Algo) [The following information applies to the questions displayed below.] Simon Company's year-end balance sheets follow. At December 31 Assets Cash Accounts receivable, net Merchandise inventory Prepaid expenses Plant assets, net Total assets Liabilities and Equity Accounts payable Long-term notes payable Common stock, $10 par value Retained earnings Total liabilities and equity For Year Ended December 31 Sales Cost of goods sold Other operating expenses Exercise 13-11 (Algo) Analyzing profitability LO P3 Interest expense Income tax expense Total costs and expenses Net income Earnings per share For both the current year and one year ago, compute the following ratios: Current Year The company's income statements for the Current Year and 1 Year Ago, follow. $ 460,312 233,929 12,828 9,810 $ 34,590 97,275 124,801 11,139 312,664 $ 580,469 $ 143,091 106,946 162,500 167,932 $ 580,469 Compute the price-earnings ratio for each year.…arrow_forwardVishnuarrow_forward
- Simon Company's year-end balance sheets follow. At December 31 Assets Cash Accounts receivable, net Merchandise inventory Prepaid expenses Plant assets, net Total assets Liabilities and Equity Accounts payable Long-term notes payable Common stock, $10 par value Retained earnings Total liabilities and equity For Year Ended December 31 Sales Cost of goods sold Other operating expenses Current Year $ 31,800 89,500 112,500. 10,700 278,500 $ 523,000 Interest expense Income tax expense Total costs and expenses Net income. Earnings per share $ 129,900 98,500 163,500 131,100 $ 523,000 Current Year $ 411,225 209,550 1 Year Ago $ 35,625 62,500 82,500 9,375 255,000 $ 445,000 The company's income statements for the current year and one year ago follow. Assume that all sales are on credit: 4 12,100 9,525 $ 75,250 101,500 163,500 104,750 $ 445,000 $ 673,500 2 Years Ago 642,400 $ 31,100 $ 1.90 $ 37,800 50,200 54,000 5,000 230,500 $ 377,500 $51,250 83,500 163,500 79,250 $ 377,500 1 Year Ago $ 345,500…arrow_forwardThe following information relates to SE10-5 through SE10-7: (in millions) Net sales... Cost of goods sold SE10-7. Gross profit. Selling and administrative expenses Income from operations Interest expense.. EVANS & SONS, INC. Income Statement For Years Ended December 31, 2019 and 2018 Income before income taxes Income tax expense. Net income (in millions) Assets Current assets Cash and cash equivalents Accounts receivable Inventory.. Other current assets. Total current assets Property, plant, & equipment (net) Other assets. Total Assets Liabilities and Stockholders' Equity Current liabilities. Long-term liabilities. Total liabilities.. EVANS & SONS, INC. Balance Sheet December 31, 2019 and 2018 Stockholders' equity - common. Total Liabilities and Stockholders' Equity.. 2019 9,800 (5,500) 4,300 (2,800) 1,500 (300) $ 1,200 2019 100 900 500 400 2018 1,900 2,600 5,700 $10,200 9,300 (5,200) 4,100 (2,700) (220) (200) $980 $950 1,400 $ (250) 1,150 2018 300 800 650 250 2,000 2,500 5,900 $10,400…arrow_forwardRequired information [The following information applies to the questions displayed below.] Simon Company's year-end balance sheets follow. At December 31 Assets Cash Accounts receivable, net Merchandise inventory Prepaid expenses Plant assets, net Total assets Liabilities and Equity Accounts payable Long-term notes payable Common stock, $10 par value Retained earnings Total liabilities and equity For Year Ended December 31 Sales Cost of goods sold Other operating expenses Current Year 1 Year Ago $ 31,099 $ 26,605 89, 200 114,500 62,900 85,000 8,568 221, 258 8,163 209,503 $ 460, 131 $ 396,665 Interest expense Income tax expense Total costs and expenses Net income Earnings per share $ 112,281 84,775 162,500 100,575 $ 460,131 $ 396,665 $ 65,696 89,408 162,500 79, 061 Current Year The company's income statements for the current year and one year ago follow. Assume that all sales are on credit: $364,884 185,433 10, 169 7,776 $598,170 2 Years Ago 568, 262 $ 29,908 $ 1.84 $ 32,725 50,800…arrow_forward
- Patton Corporation had the following items on its financial statements for two recent years: Line Item Description Year 2 Year 1 Sales $2,500,000 $2,000,000 Cost of goods sold 1,975,000 1,600,000 Cash 500,000 475,000 Temporary investments 150,000 150,000 Accounts receivable (net) 200,000 175,000 Inventory 325,000 300,000 Accounts payable 450,000 400,000 Based on these data, calculate Patton Corporation’s working capital for Year 2.a. $725,000b. $1,625,000c. $2,050,000d. $650,000 2. Patton Corporation had the following items on its financial statements for two recent years: Line Item Description Year 2 Year 1 Sales $2,500,000 $2,000,000 Cost of goods sold 1,975,000 1,600,000 Cash 500,000 475,000 Temporary investments 150,000 150,000 Accounts receivable (net) 200,000 175,000 Inventory 325,000 300,000 Accounts payable 450,000 400,000 Based on these data, calculate Patton Corporation’s accounts receivable turnover for Year 2.a.…arrow_forwardVery important please be correct thank youarrow_forwardUse the following information for the Problems below. Skip to question [The following information applies to the questions displayed below.]Lansing Company’s current-year income statement and selected balance sheet data at December 31 of the current and prior years follow. LANSING COMPANYIncome StatementFor Current Year Ended December 31 Sales revenue $ 127,200 Expenses Cost of goods sold 52,000 Depreciation expense 17,000 Salaries expense 28,000 Rent expense 10,000 Insurance expense 4,800 Interest expense 4,600 Utilities expense 3,800 Net income $ 7,000 LANSING COMPANYSelected Balance Sheet Accounts At December 31 Current Year Prior Year Accounts receivable $ 6,600 $ 7,800 Inventory 2,980 2,040 Accounts payable 5,400 6,600 Salaries payable 1,080 800 Utilities payable 420 260 Prepaid insurance 360 480 Prepaid rent…arrow_forward
arrow_back_ios
SEE MORE QUESTIONS
arrow_forward_ios
Recommended textbooks for you
 AccountingAccountingISBN:9781337272094Author:WARREN, Carl S., Reeve, James M., Duchac, Jonathan E.Publisher:Cengage Learning,
 Accounting Information SystemsAccountingISBN:9781337619202Author:Hall, James A.Publisher:Cengage Learning,
 Horngren's Cost Accounting: A Managerial Emphasis...AccountingISBN:9780134475585Author:Srikant M. Datar, Madhav V. RajanPublisher:PEARSON
 Intermediate AccountingAccountingISBN:9781259722660Author:J. David Spiceland, Mark W. Nelson, Wayne M ThomasPublisher:McGraw-Hill Education
 Financial and Managerial AccountingAccountingISBN:9781259726705Author:John J Wild, Ken W. Shaw, Barbara Chiappetta Fundamental Accounting PrinciplesPublisher:McGraw-Hill Education
Accounting
Accounting
ISBN:9781337272094
Author:WARREN, Carl S., Reeve, James M., Duchac, Jonathan E.
Publisher:Cengage Learning,
Accounting Information Systems
Accounting
ISBN:9781337619202
Author:Hall, James A.
Publisher:Cengage Learning,
Horngren's Cost Accounting: A Managerial Emphasis...
Accounting
ISBN:9780134475585
Author:Srikant M. Datar, Madhav V. Rajan
Publisher:PEARSON
Intermediate Accounting
Accounting
ISBN:9781259722660
Author:J. David Spiceland, Mark W. Nelson, Wayne M Thomas
Publisher:McGraw-Hill Education
Financial and Managerial Accounting
Accounting
ISBN:9781259726705
Author:John J Wild, Ken W. Shaw, Barbara Chiappetta Fundamental Accounting Principles
Publisher:McGraw-Hill Education