Theoretical Quantiles Theoretical Quantiles 7) Let's use the the data above for male kestrel length, but this time with the addition of 2 more birds (n = 12). Here are the data, sorted to help you. Most of the normal scores are also given: Length(cm): 26.1 26.4 27.0 27.0 27.2 27.3 27.3 27.7 27.9 28.4 28.5 29.1 -0.812 -0.549 -0.319 -0.105 0.105 0.319 0.549 0.812 Z-scores: (a) Calculate the missing normal scores (the first two and the last two). (b) Now construct a q-q plot (normal probability plot). Do this by hand.
Theoretical Quantiles Theoretical Quantiles 7) Let's use the the data above for male kestrel length, but this time with the addition of 2 more birds (n = 12). Here are the data, sorted to help you. Most of the normal scores are also given: Length(cm): 26.1 26.4 27.0 27.0 27.2 27.3 27.3 27.7 27.9 28.4 28.5 29.1 -0.812 -0.549 -0.319 -0.105 0.105 0.319 0.549 0.812 Z-scores: (a) Calculate the missing normal scores (the first two and the last two). (b) Now construct a q-q plot (normal probability plot). Do this by hand.

MATLAB: An Introduction with Applications
6th Edition
ISBN:9781119256830
Author:Amos Gilat
Publisher:Amos Gilat
Chapter1: Starting With Matlab
Section: Chapter Questions
Problem 1P

Related questions
Question
Answer only question 7 all the way at the bottom. Make sure you show all your work
Transcribed Image Text:11:07
Not Secure - mason.gmu.edu
(a) Which test (problem (3) or problem (4)) lets you reject the null hypothesis?
(b) Which test do you *think* has more power?
30 Wh
Usually, but not always(!!), the test with the most power has a lower p-value.
(c) If you don't know that the population variances are equal, which test should you use?
(d) Which test should you use here? (Refer to (c)).
Big hint and comment:
This is an example of when the classic (= equal variance) t-test can make a serious mistake. Rejecting a
null hypothesis when it is not appropriate is a pretty serious mistake. Note also that the sample sizes are
very different.
(If you're theoretically inclined, here's what happens: even though we set α = 0.05, the classic t-test
makes a type I error at a much higher rate than 5%. In other words, despite setting α = 0.05, the actual
value of a 0.05, which is obviously not good!)
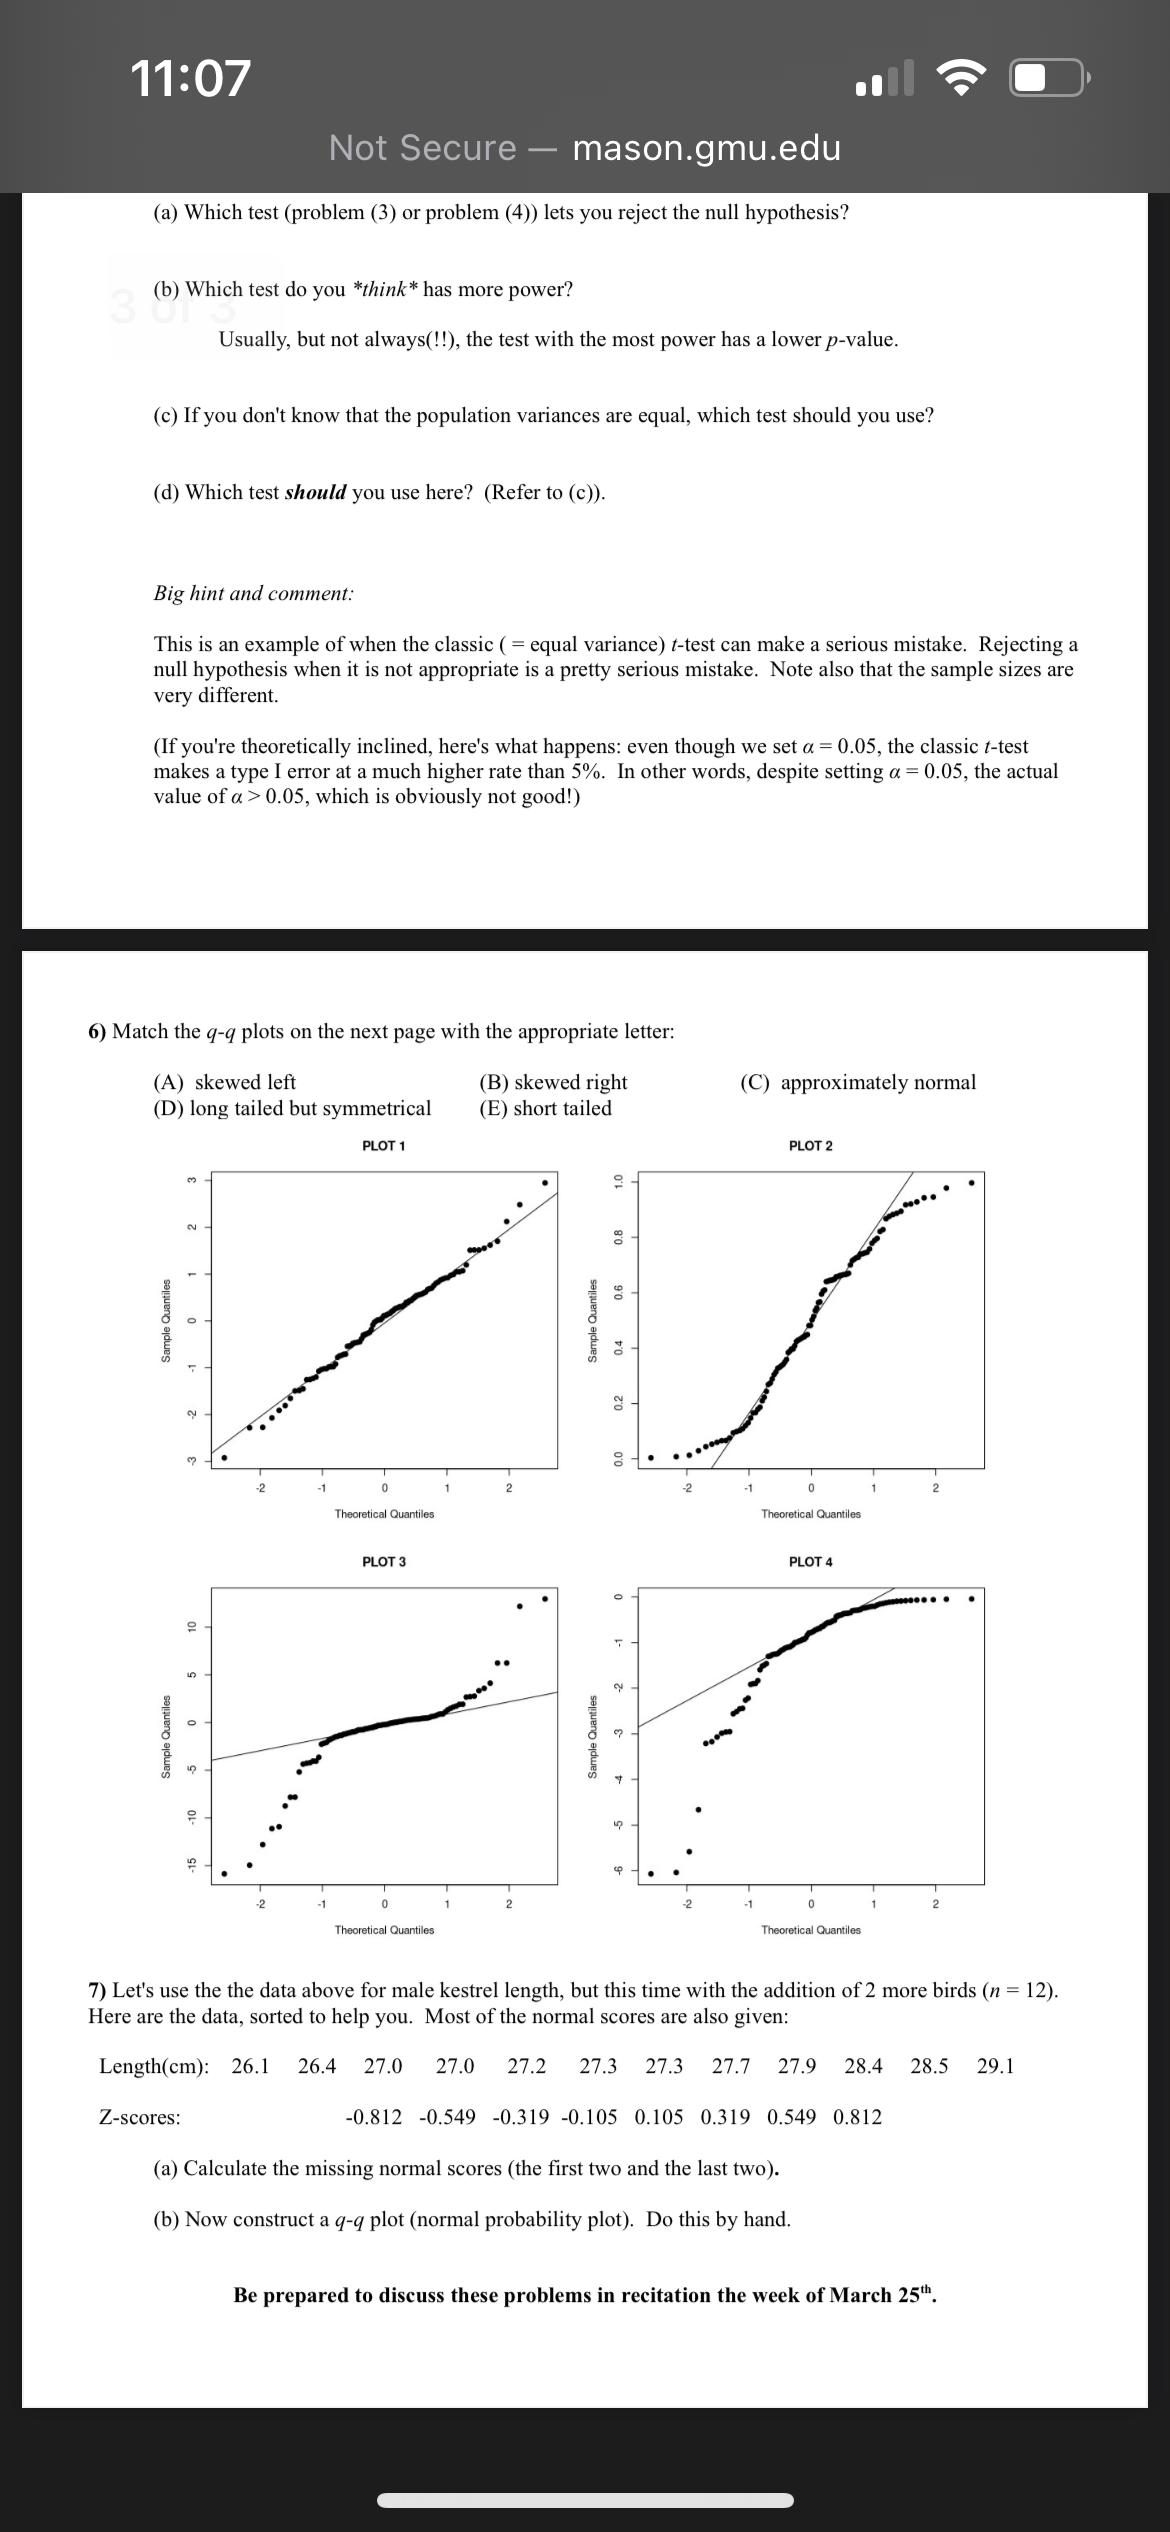
6) Match the q-q plots on the next page with the appropriate letter:
(A) skewed left
(D) long tailed but symmetrical
(B) skewed right
(E) short tailed
PLOT 1
(C) approximately normal
PLOT 2
Sample Quantiles
15
c
Sample Quantiles
10
10
3
2
2
-2
-1
1
2
Theoretical Quantiles
PLOT 3
-2
-1
1
2
Theoretical Quantiles
Sample Quantiles
ф
2
Sample Quantiles
0.4
0.6
ZO
10
-1
0
Theoretical Quantiles
PLOT 4
-1
0
Theoretical Quantiles
7) Let's use the the data above for male kestrel length, but this time with the addition of 2 more birds (n = 12).
Here are the data, sorted to help you. Most of the normal scores are also given:
Length(cm): 26.1 26.4 27.0 27.0 27.2 27.3 27.3 27.7 27.9 28.4 28.5 29.1
Z-scores:
-0.812 -0.549 -0.319 -0.105 0.105 0.319 0.549 0.812
(a) Calculate the missing normal scores (the first two and the last two).
(b) Now construct a q-q plot (normal probability plot). Do this by hand.
Be prepared to discuss these problems in recitation the week of March 25th.
Expert Solution
This question has been solved!
Explore an expertly crafted, step-by-step solution for a thorough understanding of key concepts.

This is a popular solution!

Trending now
This is a popular solution!

Step by step
Solved in 4 steps with 3 images

Recommended textbooks for you
MATLAB: An Introduction with Applications
Statistics
ISBN:
9781119256830
Author:
Amos Gilat
Publisher:
John Wiley & Sons Inc

Probability and Statistics for Engineering and th…
Statistics
ISBN:
9781305251809
Author:
Jay L. Devore
Publisher:
Cengage Learning

Statistics for The Behavioral Sciences (MindTap C…
Statistics
ISBN:
9781305504912
Author:
Frederick J Gravetter, Larry B. Wallnau
Publisher:
Cengage Learning
MATLAB: An Introduction with Applications
Statistics
ISBN:
9781119256830
Author:
Amos Gilat
Publisher:
John Wiley & Sons Inc
Probability and Statistics for Engineering and th…
Statistics
ISBN:
9781305251809
Author:
Jay L. Devore
Publisher:
Cengage Learning
Statistics for The Behavioral Sciences (MindTap C…
Statistics
ISBN:
9781305504912
Author:
Frederick J Gravetter, Larry B. Wallnau
Publisher:
Cengage Learning

Elementary Statistics: Picturing the World (7th E…
Statistics
ISBN:
9780134683416
Author:
Ron Larson, Betsy Farber
Publisher:
PEARSON

The Basic Practice of Statistics
Statistics
ISBN:
9781319042578
Author:
David S. Moore, William I. Notz, Michael A. Fligner
Publisher:
W. H. Freeman

Introduction to the Practice of Statistics
Statistics
ISBN:
9781319013387
Author:
David S. Moore, George P. McCabe, Bruce A. Craig
Publisher:
W. H. Freeman