
MATLAB: An Introduction with Applications
6th Edition
ISBN: 9781119256830
Author: Amos Gilat
Publisher: John Wiley & Sons Inc
expand_more
expand_more
format_list_bulleted
Related questions
Question
The purpose of this assignment is to learn to organize and present statistical data by using frequency distribution. You need to know how to get the number of class, class interval, and class limits. For quantitative data, get frequency distribution, relative frequency, percent frequency, and cumulative frequency. Refer to the table attached and answer the following questions:
- Get relative frequency, percent frequency, and cumulative frequency
- Comment on the shape of the distribution. Interpret the pattern of how CEOs spend their day in meetings.
- Upload the final frequency distribution table.
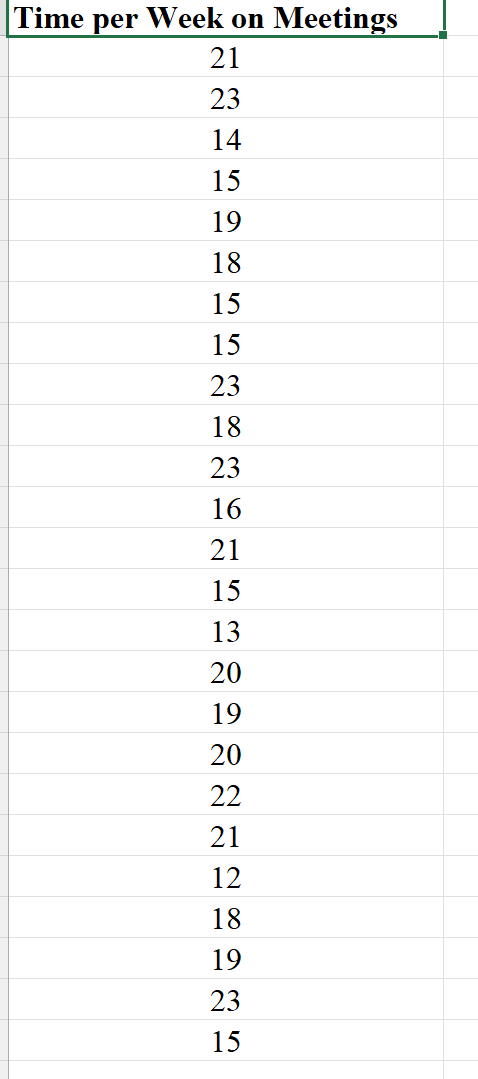

Transcribed Image Text:Time per Week on Meetings
21
23
14
15
19
18
15
15
23
18
23
16
21
15
13
20
19
20
22
21
12
18
19
23
15
Expert Solution
This question has been solved!
Explore an expertly crafted, step-by-step solution for a thorough understanding of key concepts.

This is a popular solution

Trending nowThis is a popular solution!

Step by stepSolved in 3 steps with 2 images

Knowledge Booster

Similar questions
- Joey took a survey of his classmates' food preferences and recorded them in the table below. Preferred Food Tacos Pasta Other Total Frequency 14 13 23 50 What is the relative frequency of survey members who prefer tacos.arrow_forwardThe numerical summary that is used for categorical data is a proportion. Group of answer choices True Falsearrow_forwardThe variable height that is measured into short and tall groups is considered a variable. qualitative continuous survey quantitativearrow_forward
- using the picture included to answer Besides a bar chart, what would be another appropriate graph to display this data set?arrow_forwardRun the descriptive statistics for hrs/week of exercise. Include the mean, median, quartiles, min, max, standard deviation and IQR. First do this for hrs/week of exercise overall. Copy and paste the values below. Then redo this splitting up the data by sex. Copy and paste that below too. What similarities and/or differences do you see? Age Gender Height Arm Length Number Siblings Birth Order Handedness Number Classes Number Credits Hrs. Exercise Athlete at Broome Hrs. TV Award Pulse Number Piercings Facebook Friends Followers on Instagram Tattoo Division Local section 18 f 63 27.5 2 3 r 4 14 1.5 n 3 NP 74 2 82 72 n HS y 4 19 m 74 31.5 4 5 r 4 11 5 n 1.5 O 0 600 700 n STEM y 4 17 f 66 29.2 2 2 l 6 15 5 y 21 NP 64 2 1801 1370 n HS y 4 18 f 66 30 5 5 r 4 12 30 n 15 NP 91 1…arrow_forwardDiscuss how statistics, as a way of organizing and summarizing data, helped make good decisions when shoppingarrow_forward
- What is the best way to graphically present the shape of the distribution of numeric variable? a. histogram b. scatter plot c. line graph d. pie chartarrow_forwardFor the data set 7 6 4 9 5 the medianarrow_forwardShow your work in the box below. Given this set of data: 4, 9, 8, 2, 16, 4, 4, 9, 6. Find the following and label your parts: a. mean b. mode c. rangearrow_forward
arrow_back_ios
SEE MORE QUESTIONS
arrow_forward_ios
Recommended textbooks for you
- MATLAB: An Introduction with ApplicationsStatisticsISBN:9781119256830Author:Amos GilatPublisher:John Wiley & Sons Inc
 Probability and Statistics for Engineering and th...StatisticsISBN:9781305251809Author:Jay L. DevorePublisher:Cengage Learning
 Statistics for The Behavioral Sciences (MindTap C...StatisticsISBN:9781305504912Author:Frederick J Gravetter, Larry B. WallnauPublisher:Cengage Learning
  Elementary Statistics: Picturing the World (7th E...StatisticsISBN:9780134683416Author:Ron Larson, Betsy FarberPublisher:PEARSON
 The Basic Practice of StatisticsStatisticsISBN:9781319042578Author:David S. Moore, William I. Notz, Michael A. FlignerPublisher:W. H. Freeman
 Introduction to the Practice of StatisticsStatisticsISBN:9781319013387Author:David S. Moore, George P. McCabe, Bruce A. CraigPublisher:W. H. Freeman
MATLAB: An Introduction with Applications
Statistics
ISBN:9781119256830
Author:Amos Gilat
Publisher:John Wiley & Sons Inc
Probability and Statistics for Engineering and th...
Statistics
ISBN:9781305251809
Author:Jay L. Devore
Publisher:Cengage Learning
Statistics for The Behavioral Sciences (MindTap C...
Statistics
ISBN:9781305504912
Author:Frederick J Gravetter, Larry B. Wallnau
Publisher:Cengage Learning
Elementary Statistics: Picturing the World (7th E...
Statistics
ISBN:9780134683416
Author:Ron Larson, Betsy Farber
Publisher:PEARSON
The Basic Practice of Statistics
Statistics
ISBN:9781319042578
Author:David S. Moore, William I. Notz, Michael A. Fligner
Publisher:W. H. Freeman
Introduction to the Practice of Statistics
Statistics
ISBN:9781319013387
Author:David S. Moore, George P. McCabe, Bruce A. Craig
Publisher:W. H. Freeman